Indicate changelog
Flying KPIs, Skill Marketplace, Filter: Contains, Calendar update

Flying KPIs: Automated Dashboard Reports
Schedule automated dashboard reports and receive them directly in your inbox. Select any dashboard, choose your preferred interval (Daily, Weekly, or Monthly), add your recipients, and optionally include an AI-generated summary of key insights.
You can find Flying KPIs in the left navigation under the rocket icon.
Contains Filter
Filters now support a "contains" operator for matching partial values across text fields. For example, find all campaigns with "Newsletter" in their name. You can find the filter option in your widget designer advanced metric settings.
Skill Marketplace
Our Skill Marketplace is now public. Each skill can be used independently and all three are free. The AI skills cover the full lifecycle of a data file:
data-review: inspect a raw export and get a tiered report on how to clean it for your data warehouse.
data-transform: turn that file into clean, warehouse-ready tables via a rerunnable script.
metric-creator: build DSL-compatible metric and dimension definitions on top of clean data.
The metric-creator is especially useful if you want to build your own metrics directly in Cube Studio. The data-review and data-transform skills are the right choice when you import your own data into Indicate and want to clean it up beforehand.
All three skills work with any AI setup, no matter which AI client you use.
You can find the Skill Marketplace and setup instructions here:
https://github.com/insanetic/data-max/tree/main
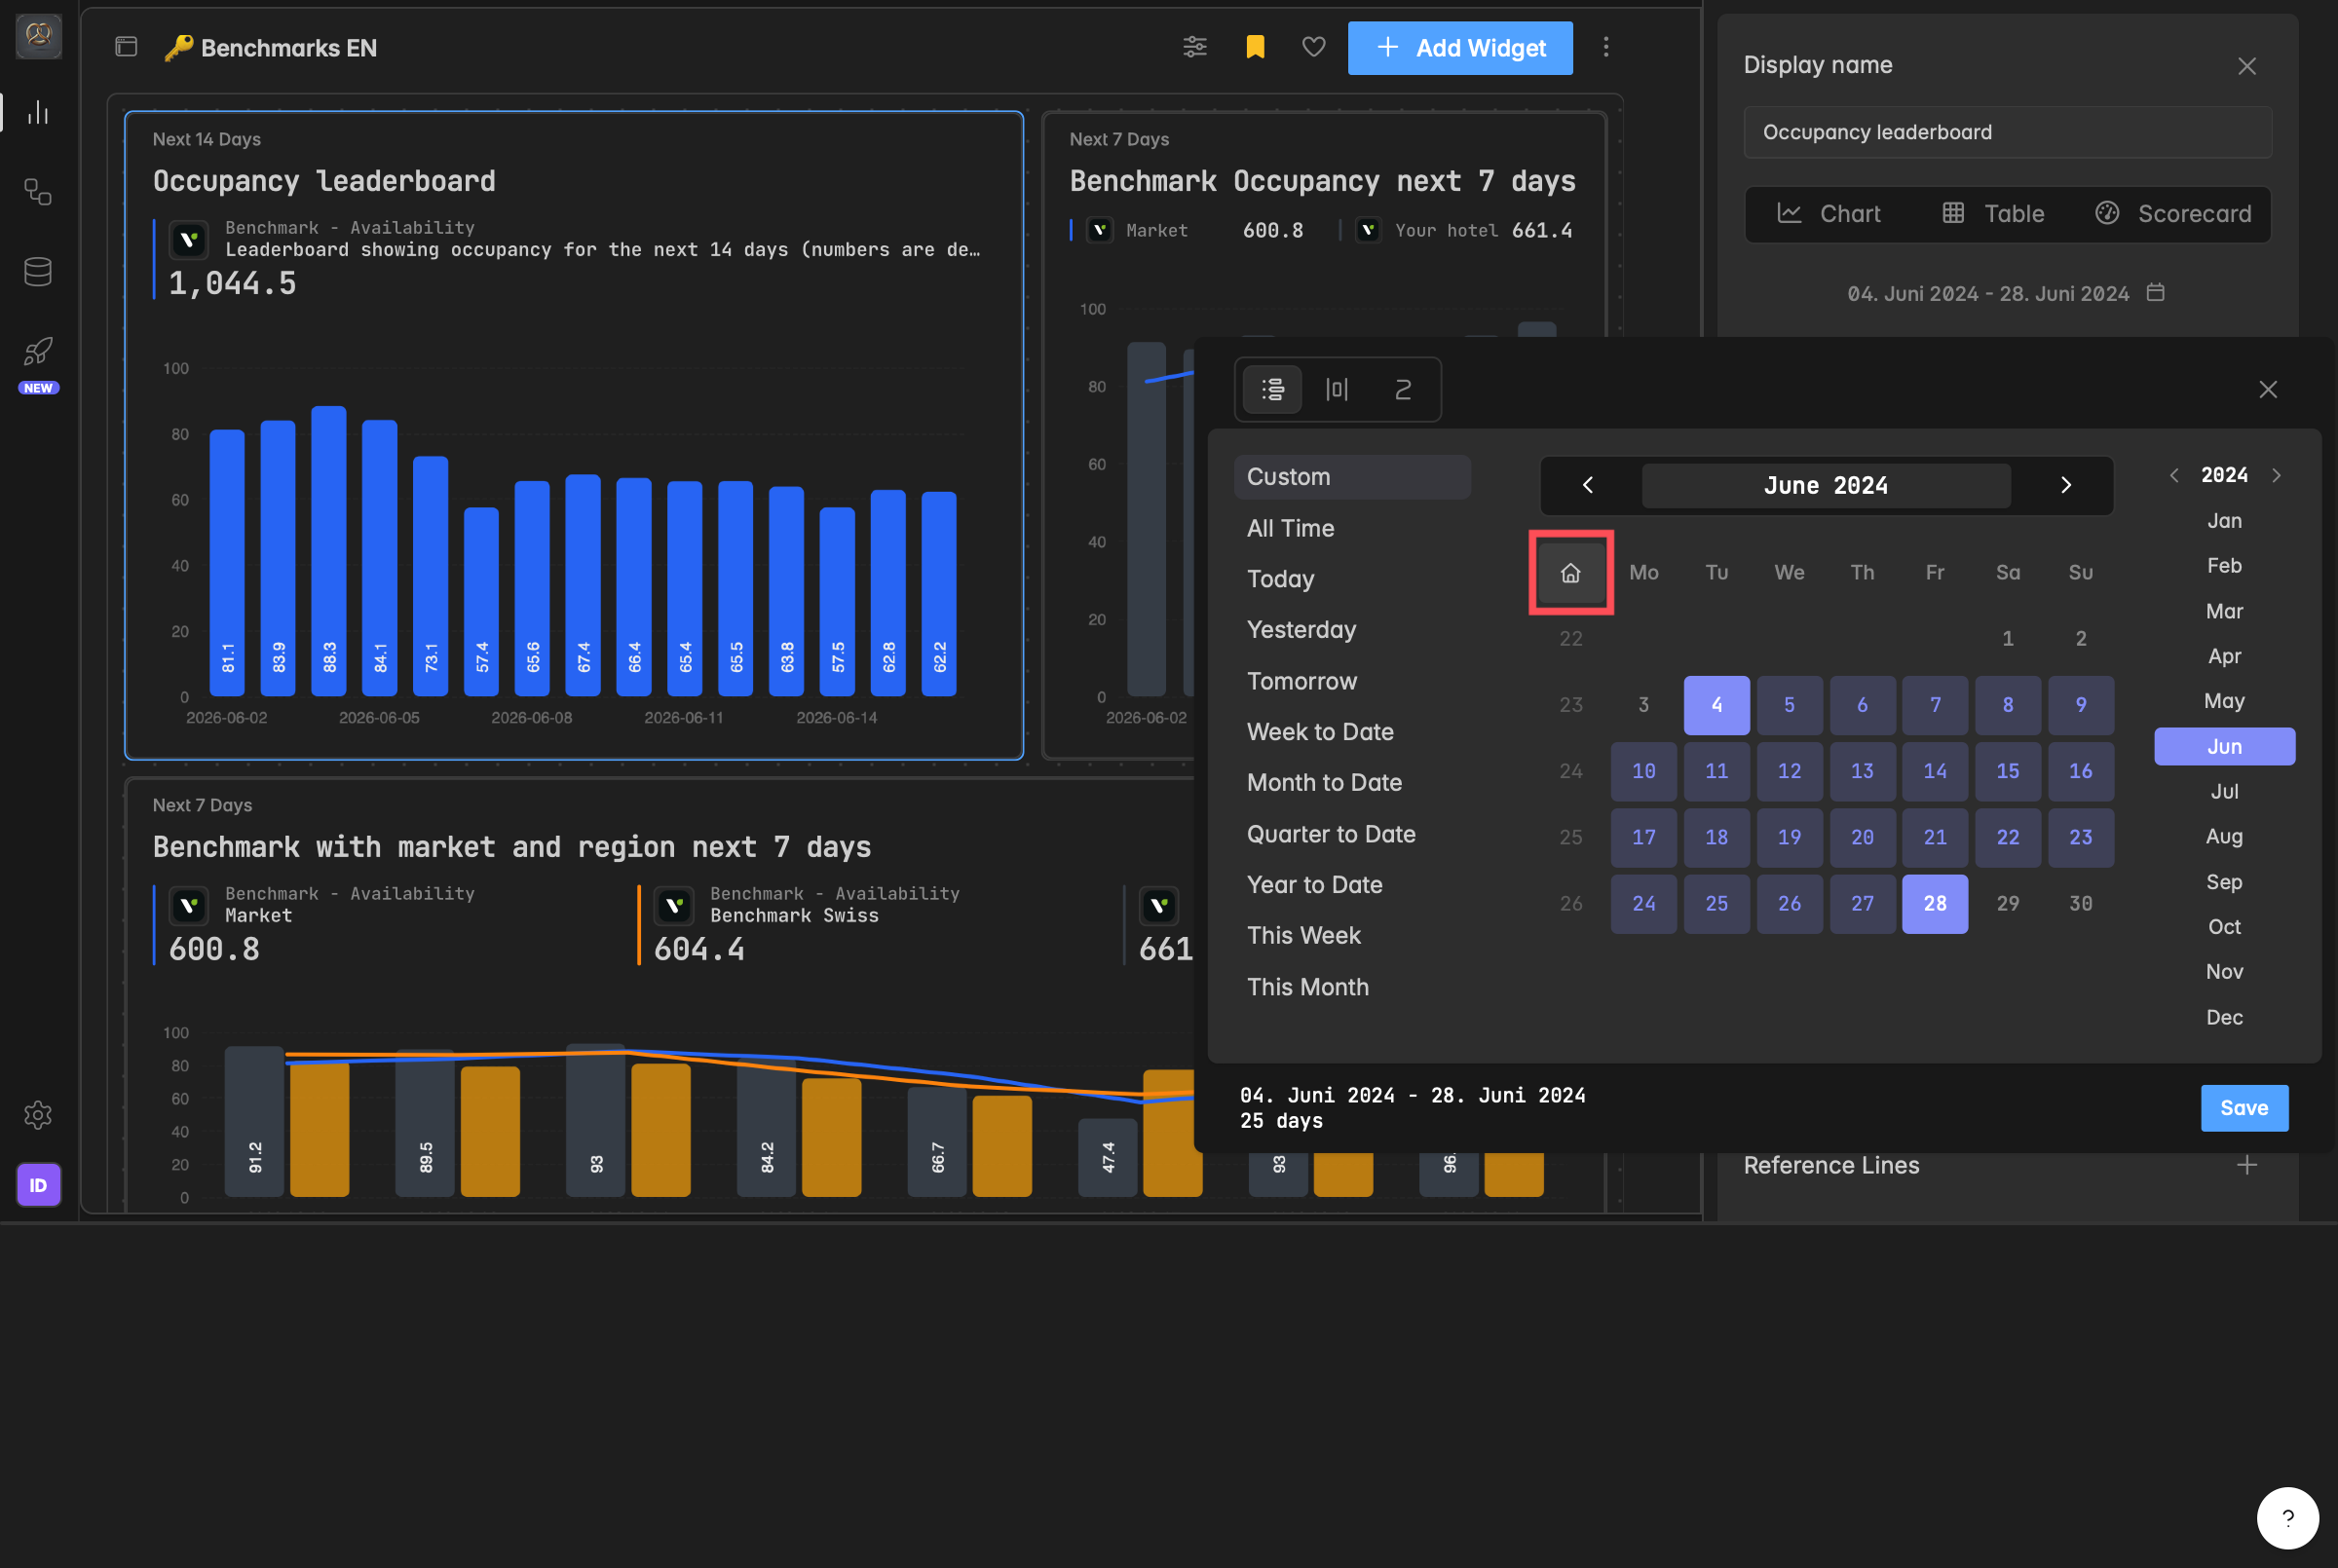
Calendar: New Navigation Options
The calendar has three improvements:
A house icon brings you back to today's date in one click.
New year navigation in the top right lets you jump between years directly.
And a new "All Time" option lets you see your full date range at once.
Re:Guest Communication Integration: New Metrics
Four new metrics are now available for Re:Guest Communication users:
Avg. Booking Rate
Avg. Click Rate
Avg. Interaction Rate
Total Reservations