Docs / Advanced
Data Studio
Explore the raw data behind your metrics in the Data Studio. Learn how to read Indicate system columns, find the connection_id to filter multiple connections of the same source, and troubleshoot missing, empty, or duplicated data.
What is the Data Studio?
The Data Studio gives you a direct view into the raw data stored in your Indicate warehouse. You can browse all tables synced from your connected data sources, inspect their column structure, and preview actual data rows.
All data shown is raw and unprocessed, exactly as it was synced from the source
Data is organized by schema and each connected data source gets its own schema
Use it to explore which fields are available and plan which metrics you can build
The Data Studio is the most honest view of your source data. If something looks off here, the root cause is almost always in the original system. Use it as a tool to audit your data quality and clean up at the source.
What data is visible?
The Data Studio only shows data from sources you have connected in your own space. Data from shared spaces or connections that belong to other spaces is not visible here.
The Data Studio gives you access to the full raw data from your source, not just the metrics we expose in the dashboards. You see every column and every row the source delivers, including fields that are not part of any pre-built metric.
The Data Studio is only visible to Admins. Regular members and viewers do not have access to this section.
Shared data products show up in the Cube Studio only in the space where their source is connected, not in spaces they are shared into.
Working in the Data Studio
The Data Studio offers several features for exploring, filtering and exporting your data.
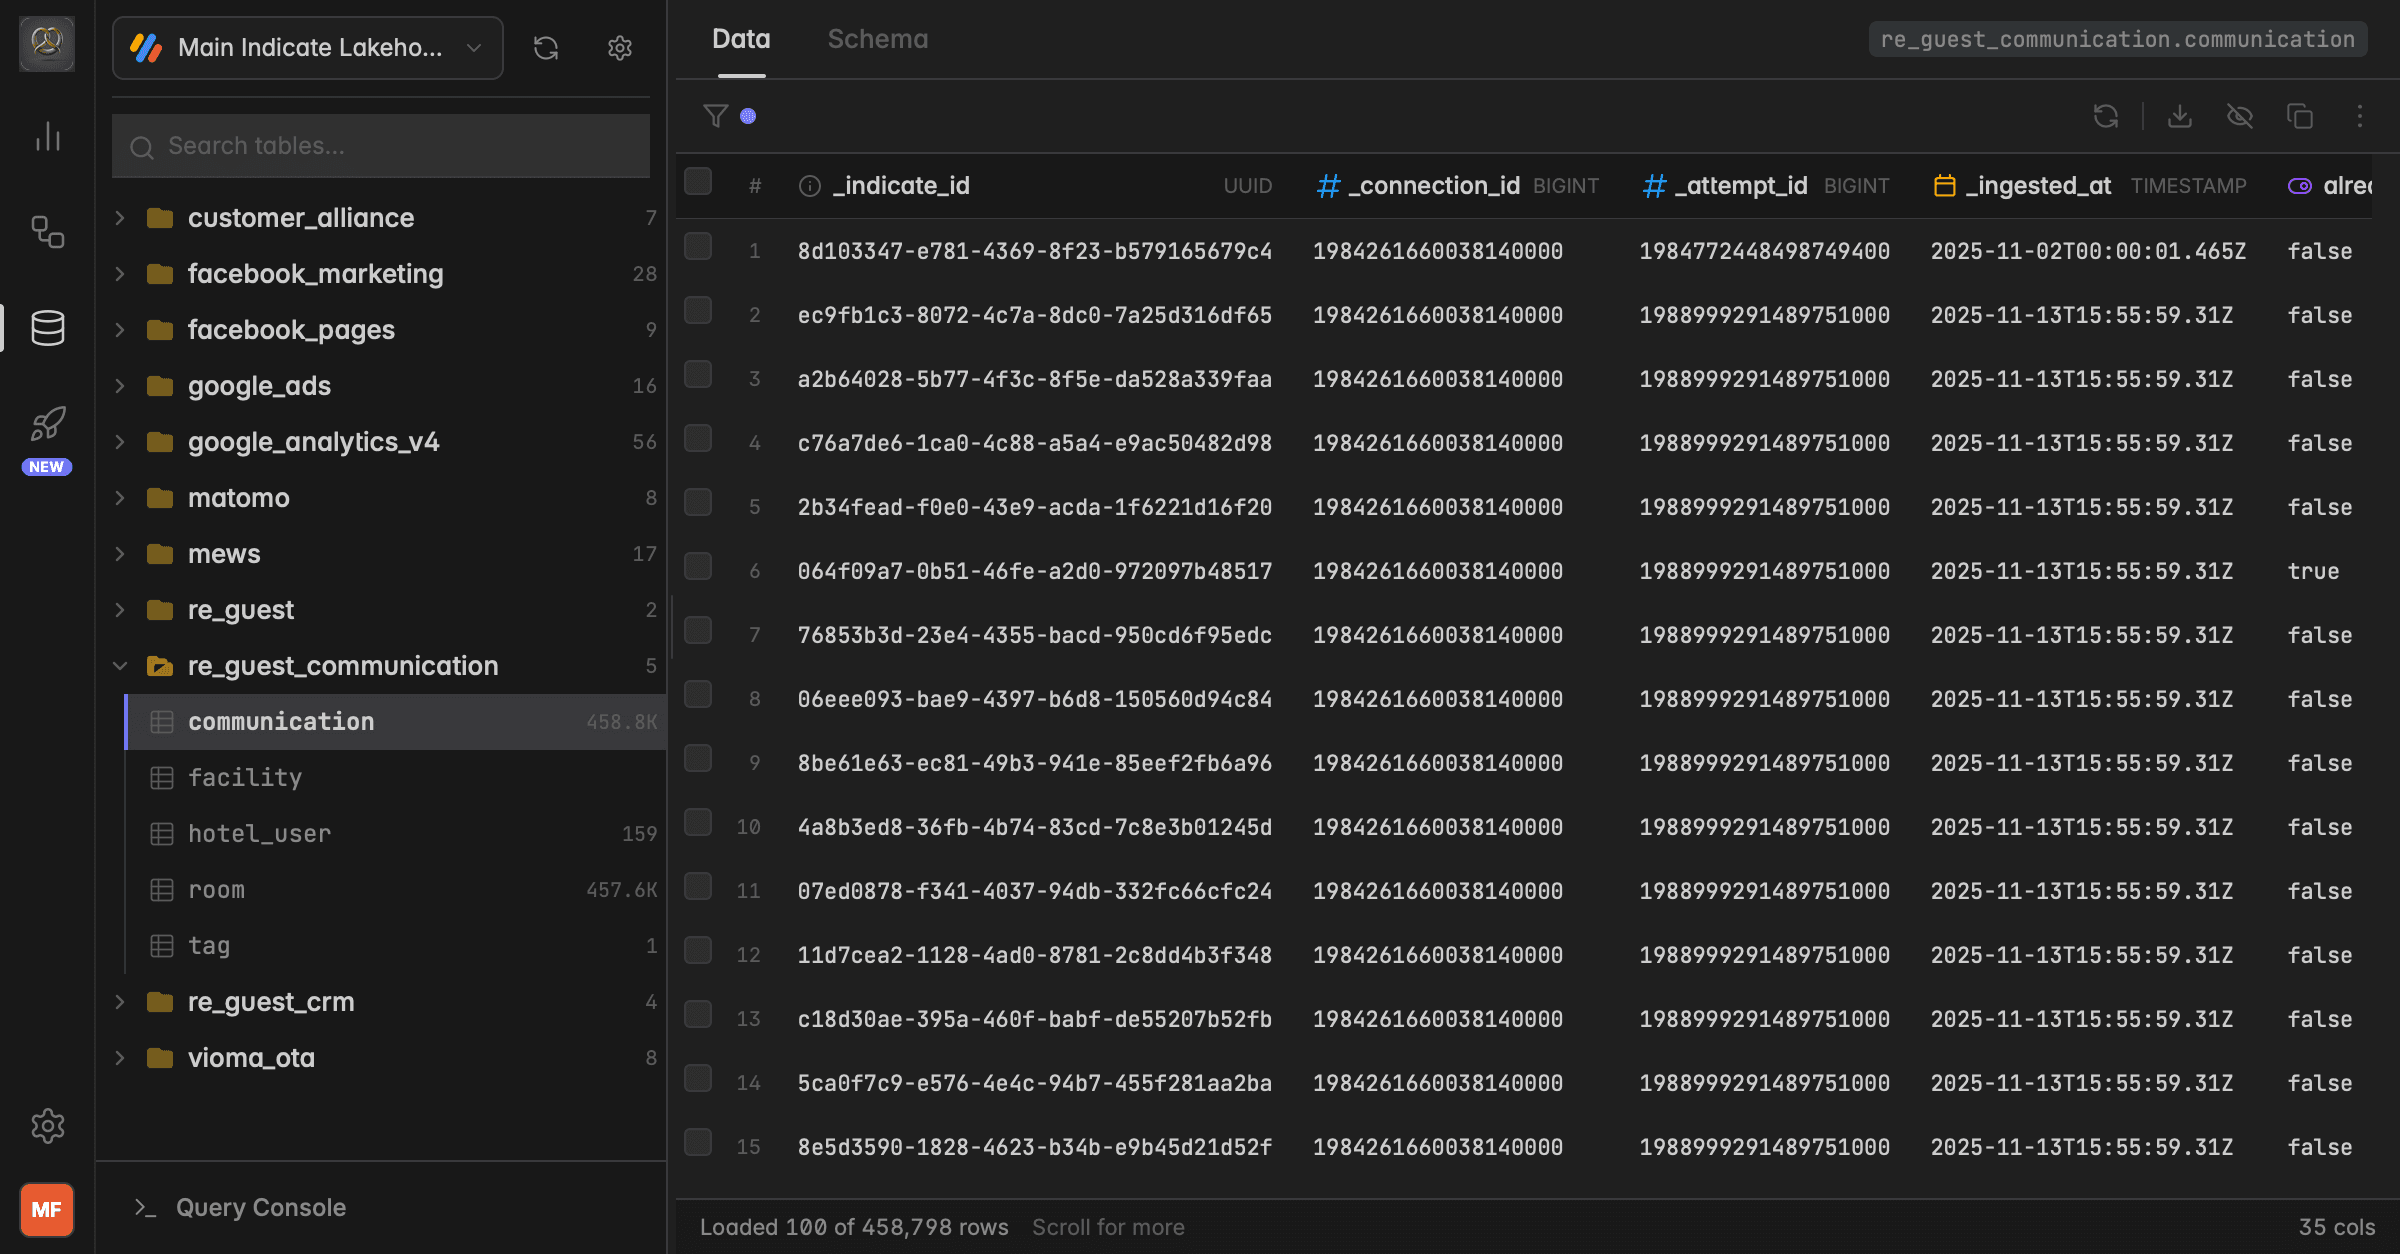
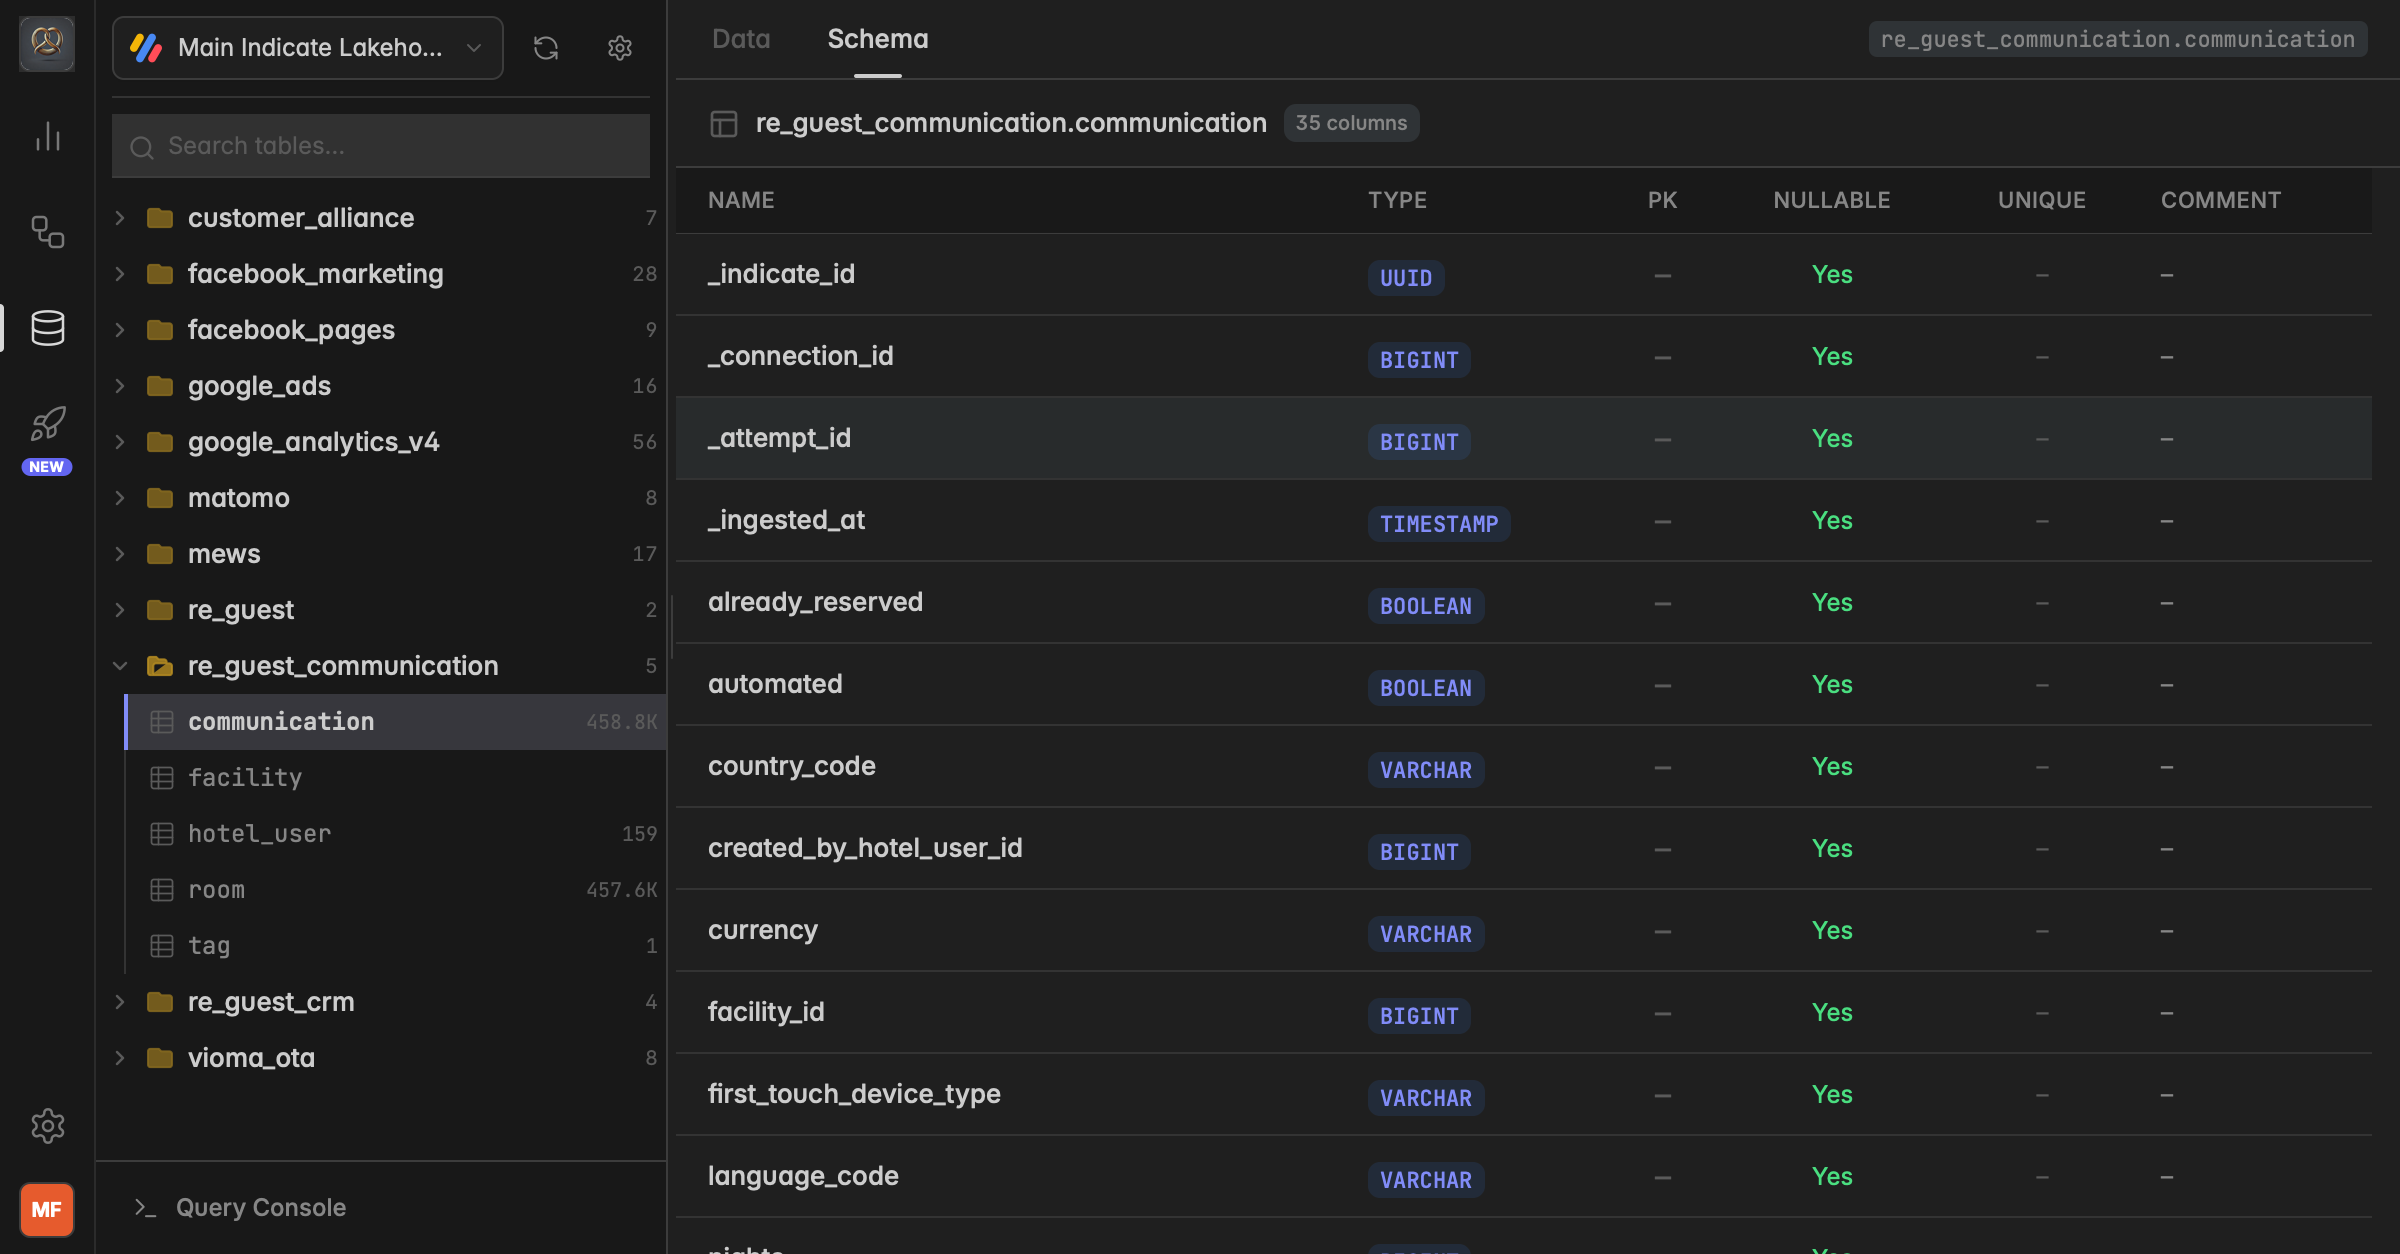
Data and Schema view
Every table has two views:
Data — the actual rows of your data
Schema — the column structure of the table, including column names, types, nullability and primary keys
Filtering rows
You can filter any table using the filter icon in the top left of the data view. The fastest way to build a filter is to right-click any cell in the table. A context menu opens with options like:
Filter
$and→ narrow down with conditions like=,≠,>,≥,<,≤,IS NULL,IS NOT NULLFilter
$or→ add alternative conditionsCopy value or Copy row as JSON for individual cells or rows
The filter is then shown in the filter bar at the top and can be edited directly. Click Apply to run it.
To filter for one specific connection, right-click the value in the
_connection_idcolumn of any row and chooseFilter $and→_connection_id = .... This is the fastest way to isolate data from one source when multiple are connected.
Exporting data
Click the download icon in the top right of the data view to open the export dialog. You can choose the scope and the format:
Scope
Export selected — only the rows you have manually selected via the checkboxes
Export by filter — the rows matching your current filter
Complete export — the entire table
Formats
CSV, JSON, SQL, Parquet, Excel, XML. For CSV you can also choose the separator and whether to include column headers.
Reload data
The refresh icon in the top right reloads the current view. It does not trigger a new sync from the source. New data appears here automatically after the next scheduled sync of your pipeline.
Show DDL and Copy query
In the top-right menu (three dots) you will find two technical features:
View table schema — opens the schema view of the table
Show DDL — shows the
CREATE TABLEstatement of the table. Useful when you want to build new metrics with an AI assistant and need to give it the exact table structure as context.Copy query — copies the currently applied query (including your filters) as a DSL (Domain Specific Language) JSON object. You can paste this into an AI assistant or share it with support when reporting an issue.
Indicate system columns
The first four columns in every Data Studio table are defined by Indicate and exist in every dataset:
indicate_idconnection_idattempt_idingested_at
Multiple connections of the same source
If you have connected the same source type more than once (for example two GA4 properties or two MEWS accounts), all rows land in the same table. Each row keeps its own connection_id, so you can always tell which connection a row belongs to.
To view data from one specific connection, filter the table by its connection_id.
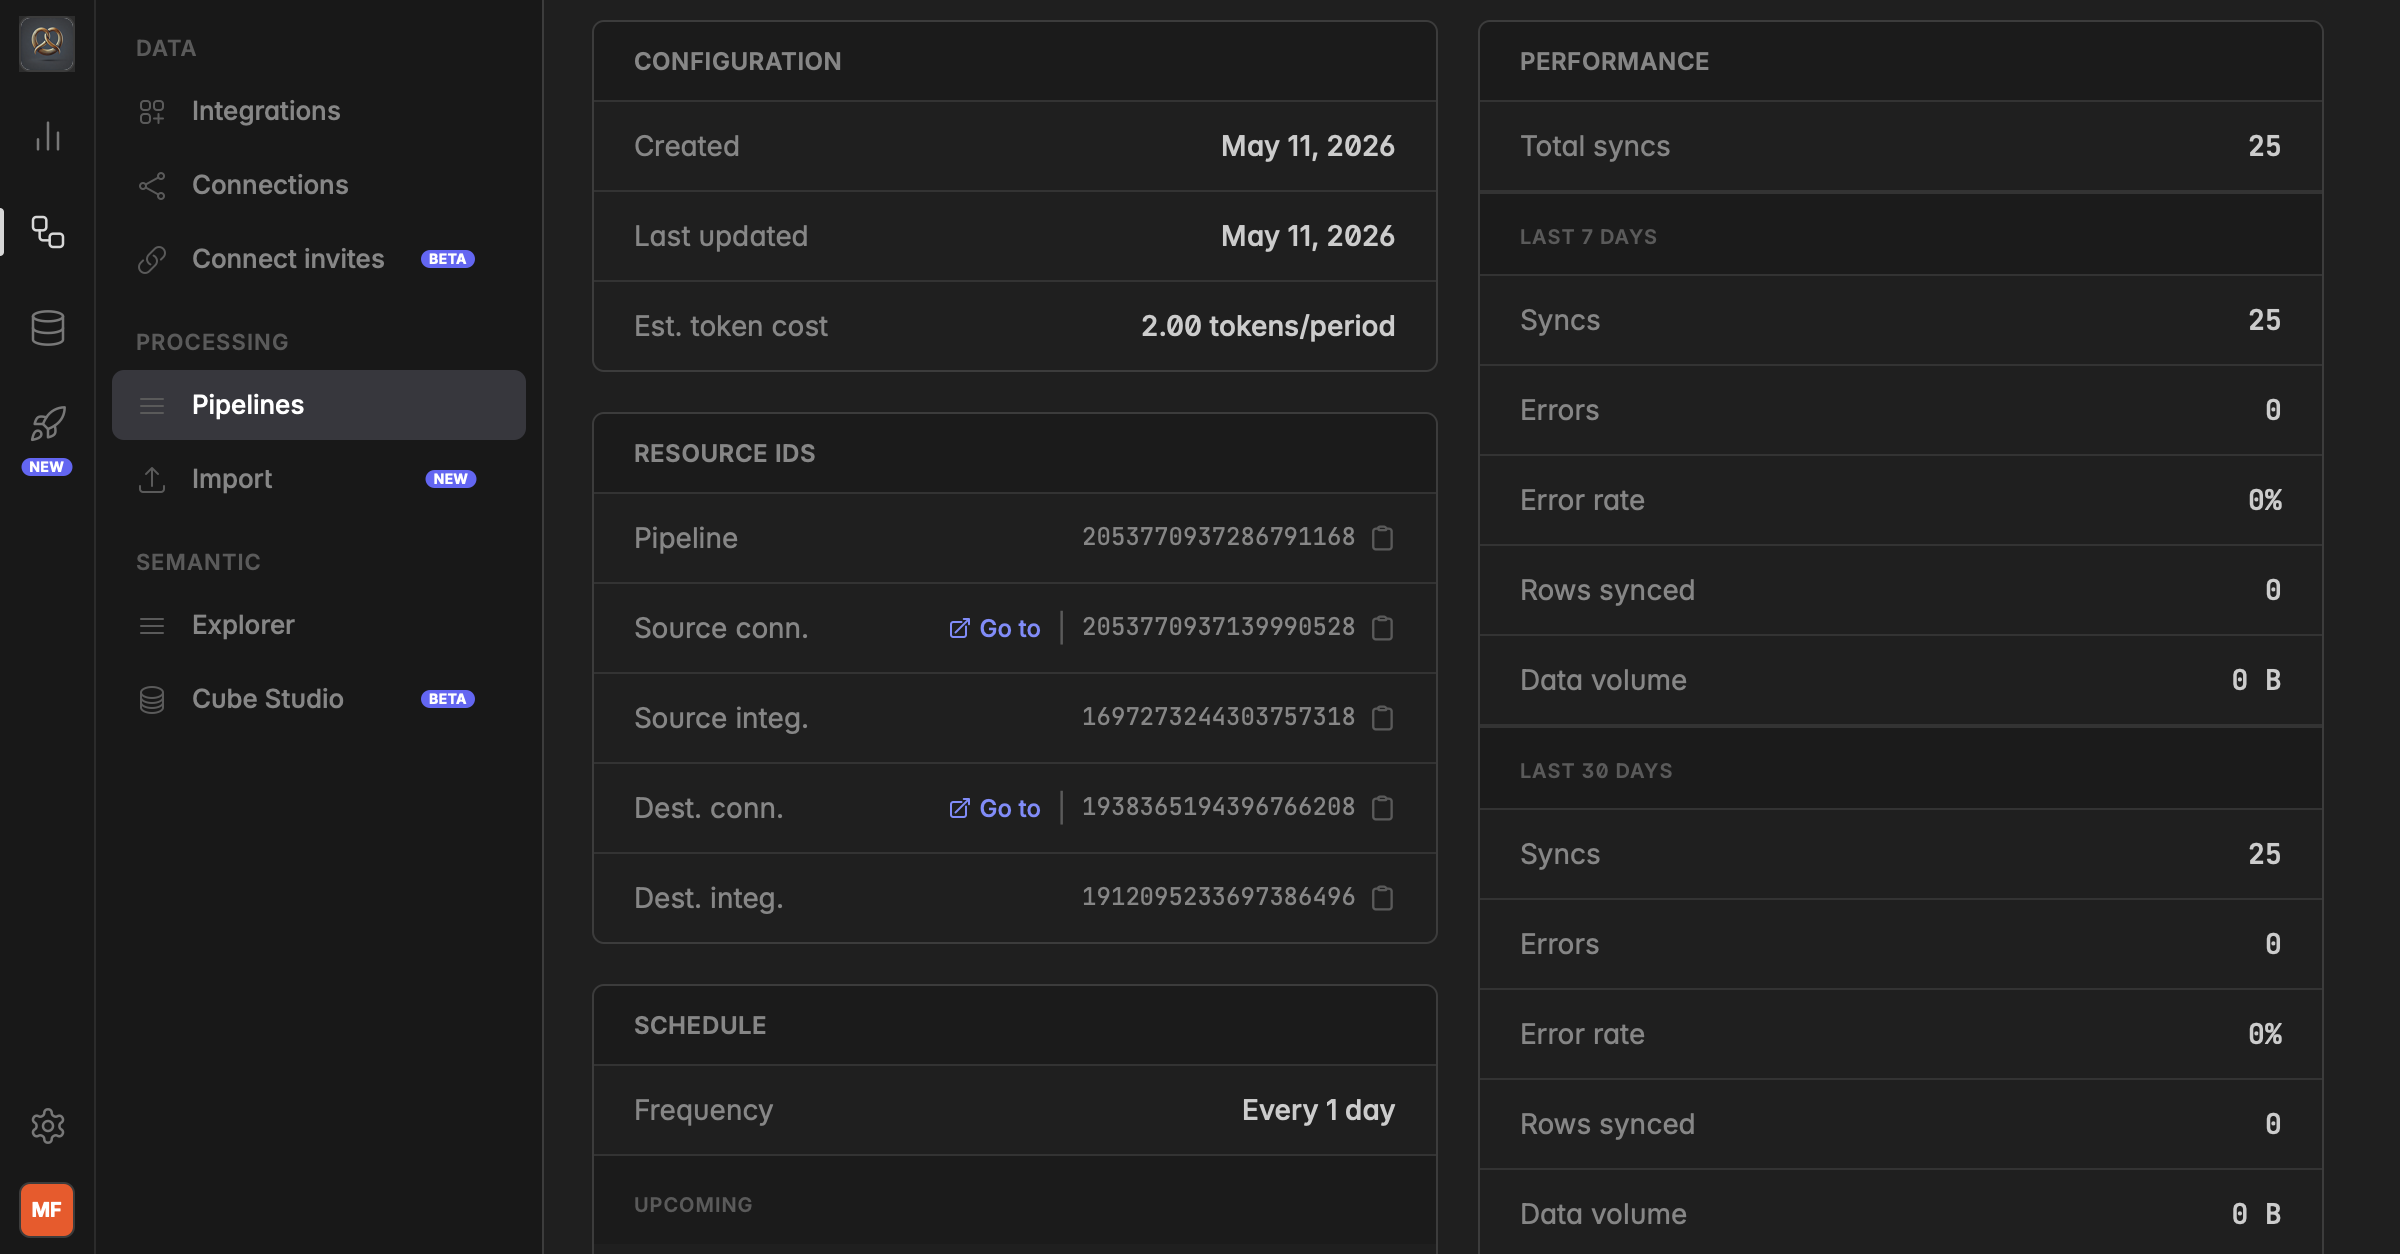
How to find the connection_id
Go to
Engineering→Processing→PipelinesClick on the pipeline of the source you are looking for
In the preselected
Flowsection you will find theRESOURCE IDSpanel where you will find:Pipeline ID
Source connection ID ← use this to filter in the Data Studio
Source integration ID
Destination connection ID
Destination integration ID
You can also read the
connection_iddirectly from the pipeline URL. The URL contains two number sequences:The first number is the space ID
The second number is the connection ID
Copy the
connection_idstraight from the Resource IDs panel using the copy icon. Then paste it into your filter in the Data Studio.
Troubleshooting
Why do I not see any data in the Data Studio?
You have not connected any data sources in this space yet. Go to Add a data source and connect your first source.
If Data Products were shared with you, you still cannot view the raw underlying tables in the Data Studio.
Only Admins can access the Data Studio. If you are not an Admin, ask your Admin to grant you Admin permissions.
Why are some tables or fields empty?
PII settings on the connection. Fields marked as PII during the connection setup are excluded from the Data Studio. Review the PII settings of your connection and re-sync if needed.
The feature is not used in your source system. The Data Studio only shows data that actually exists in the source. If a field is empty here, check whether it is filled in your original system (for example ReGuest, MEWS, Apaleo, GA4).
Connection settings exclude the data. The original source system may not provide data for those tables, or the connection settings may exclude syncing them.
Was this helpful?