Docs / Widgets
Add comparisons
Comparisons overlay prior periods or reference baselines to show change over time. Add multiple comparisons and configure labels, colors, and polarity.

What are comparisons?
The Comparisons feature lets you overlay historical or reference data directly onto your widgets.
It’s designed to show performance changes over time, such as year-over-year, month-over-month, or against a fixed baseline.
You can add multiple comparisons (e.g., “Comparison year 1”, “Comparison year 2”, etc.) to track trends across several periods at once.
Comparisons are automatically aligned with your selected time range (e.g., Day, Week, Month, Year).
You can add several comparison lines per metric.
Each comparison can have its own color, label, and configuration.
What comparison types are available?
Each comparison can be set to one of three modes:
Function | Logic | Best Question to Ask |
|---|---|---|
Period over Period | Steps back sequentially (Previous 7 days). | "Are we trending up or down compared to last week?" |
Like for Like | Jumps to the same dates in the past (Same 7 days last year). | "Is this season better than last year?" |
Reference | Compares against a fixed plan value via Key. | "Did we hit our target?" |
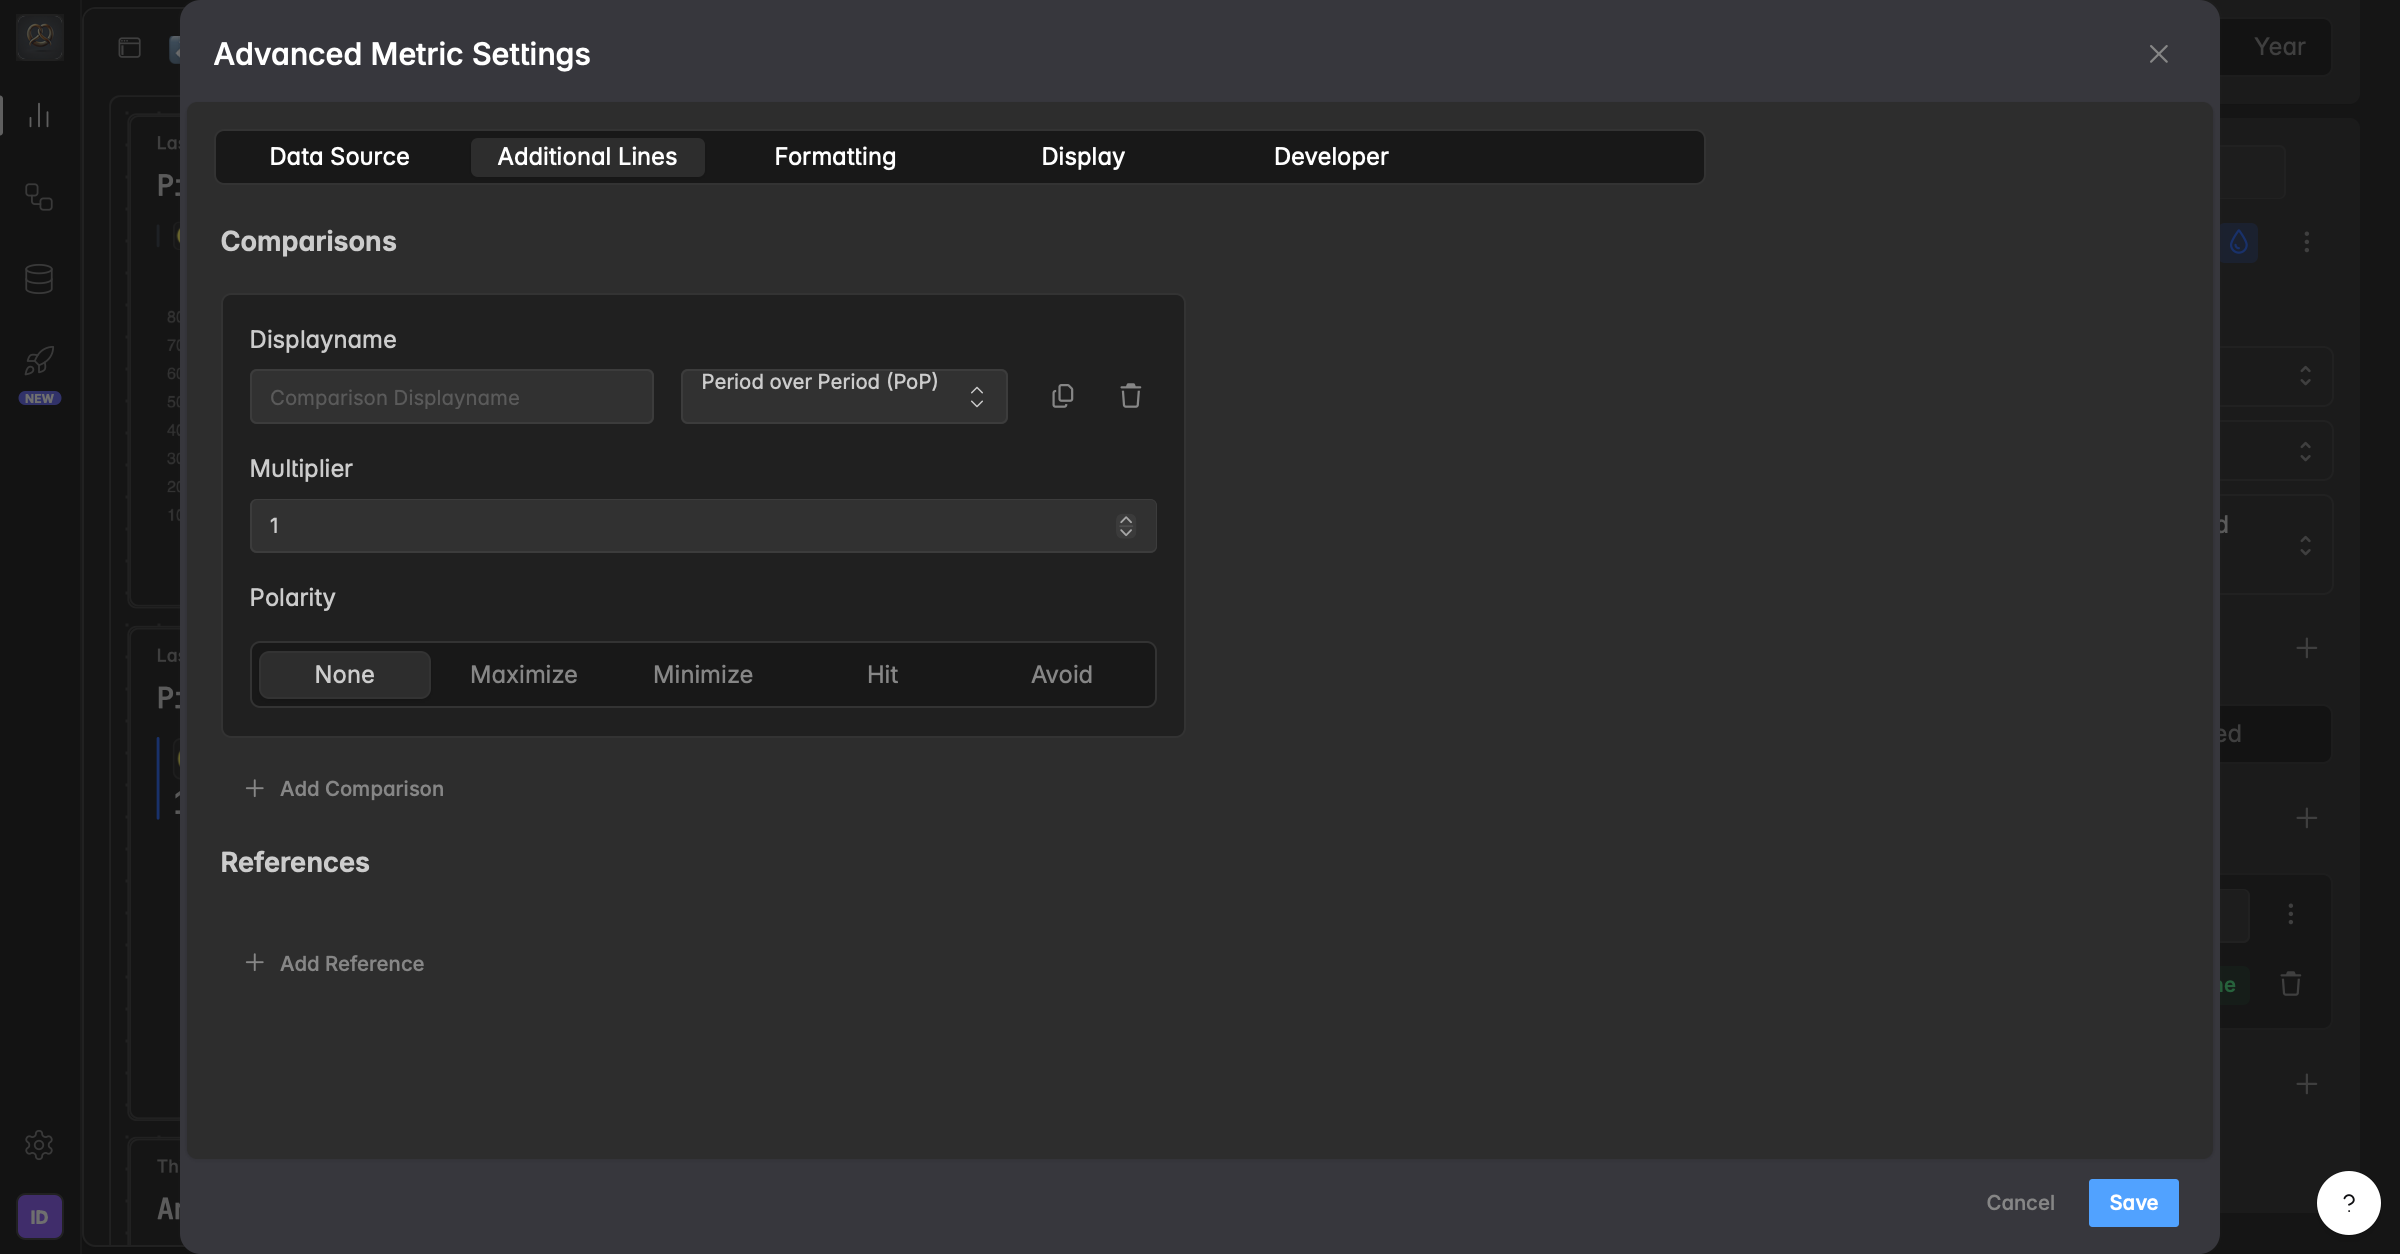
Period over Period (sequential comparison)
How it works:
"Period over Period" compares your current selected timeframe with the immediately preceding period of the same length. It is a sequential look back in time.
The Multiplier:
You can use the Multiplier to decide how many period-steps to go back.
Multiplier 1 (Default): Compares current data with the period directly before it.
Multiplier 2: Skips the previous period and compares with the one before that.
When to use it:
Best for short-term trend analysis to check immediate performance changes (e.g., week-over-week).
Example:
You select a timeframe of 7 days (Oct 8th – Oct 14th).
Comparison: The system compares this to the previous 7 days (Oct 1st – Oct 7th).
Insight: "Did we perform better this week compared to last week?"
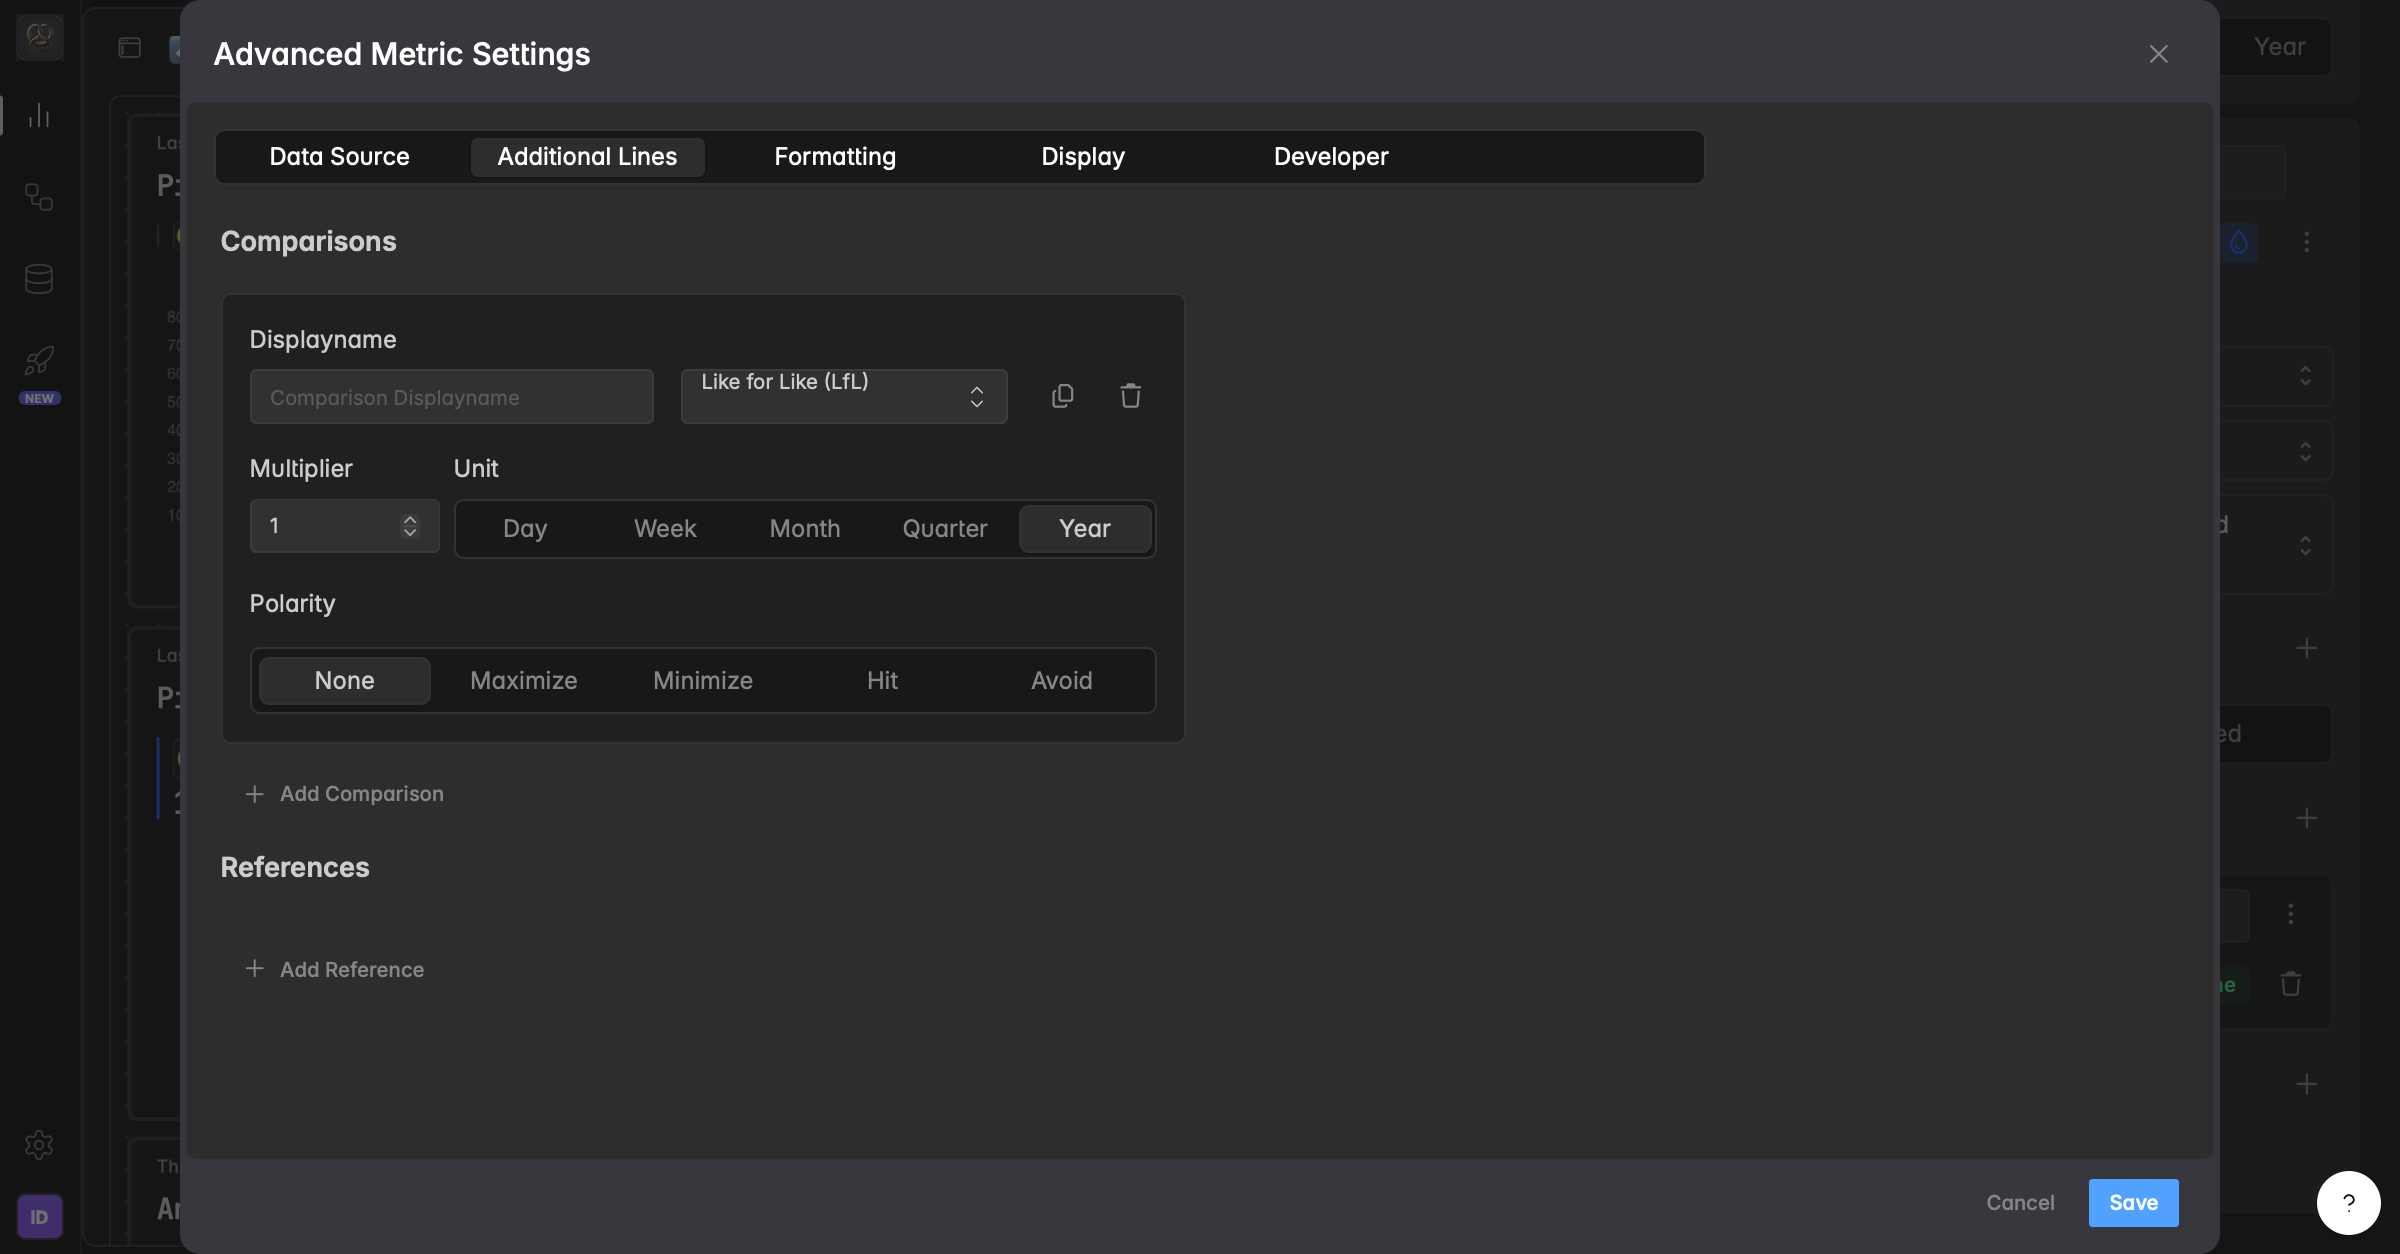
Like for Like (Historical Comparison)
How it works:
"Like for Like" compares your current selection to the identical date range within a past scope (e.g., Previous Month, Previous Quarter, Previous Year). It ignores the time in between and jumps to the exact historical match.
When to use it:
This is the best tool for Year-over-Year or seasonal comparisons. Unlike Period over Period (where you would have to calculate 52 weeks back), Like for Like automatically finds the correct dates in the previous year, accounting for calendar shifts.
Example:
You select a timeframe of 7 days (Oct 8th – Oct 14th) and set the scope to "Year".
Comparison: The system compares this to Oct 8th – Oct 14th of the previous year.
Insight: "How does our performance compare to the exact same time last year?"
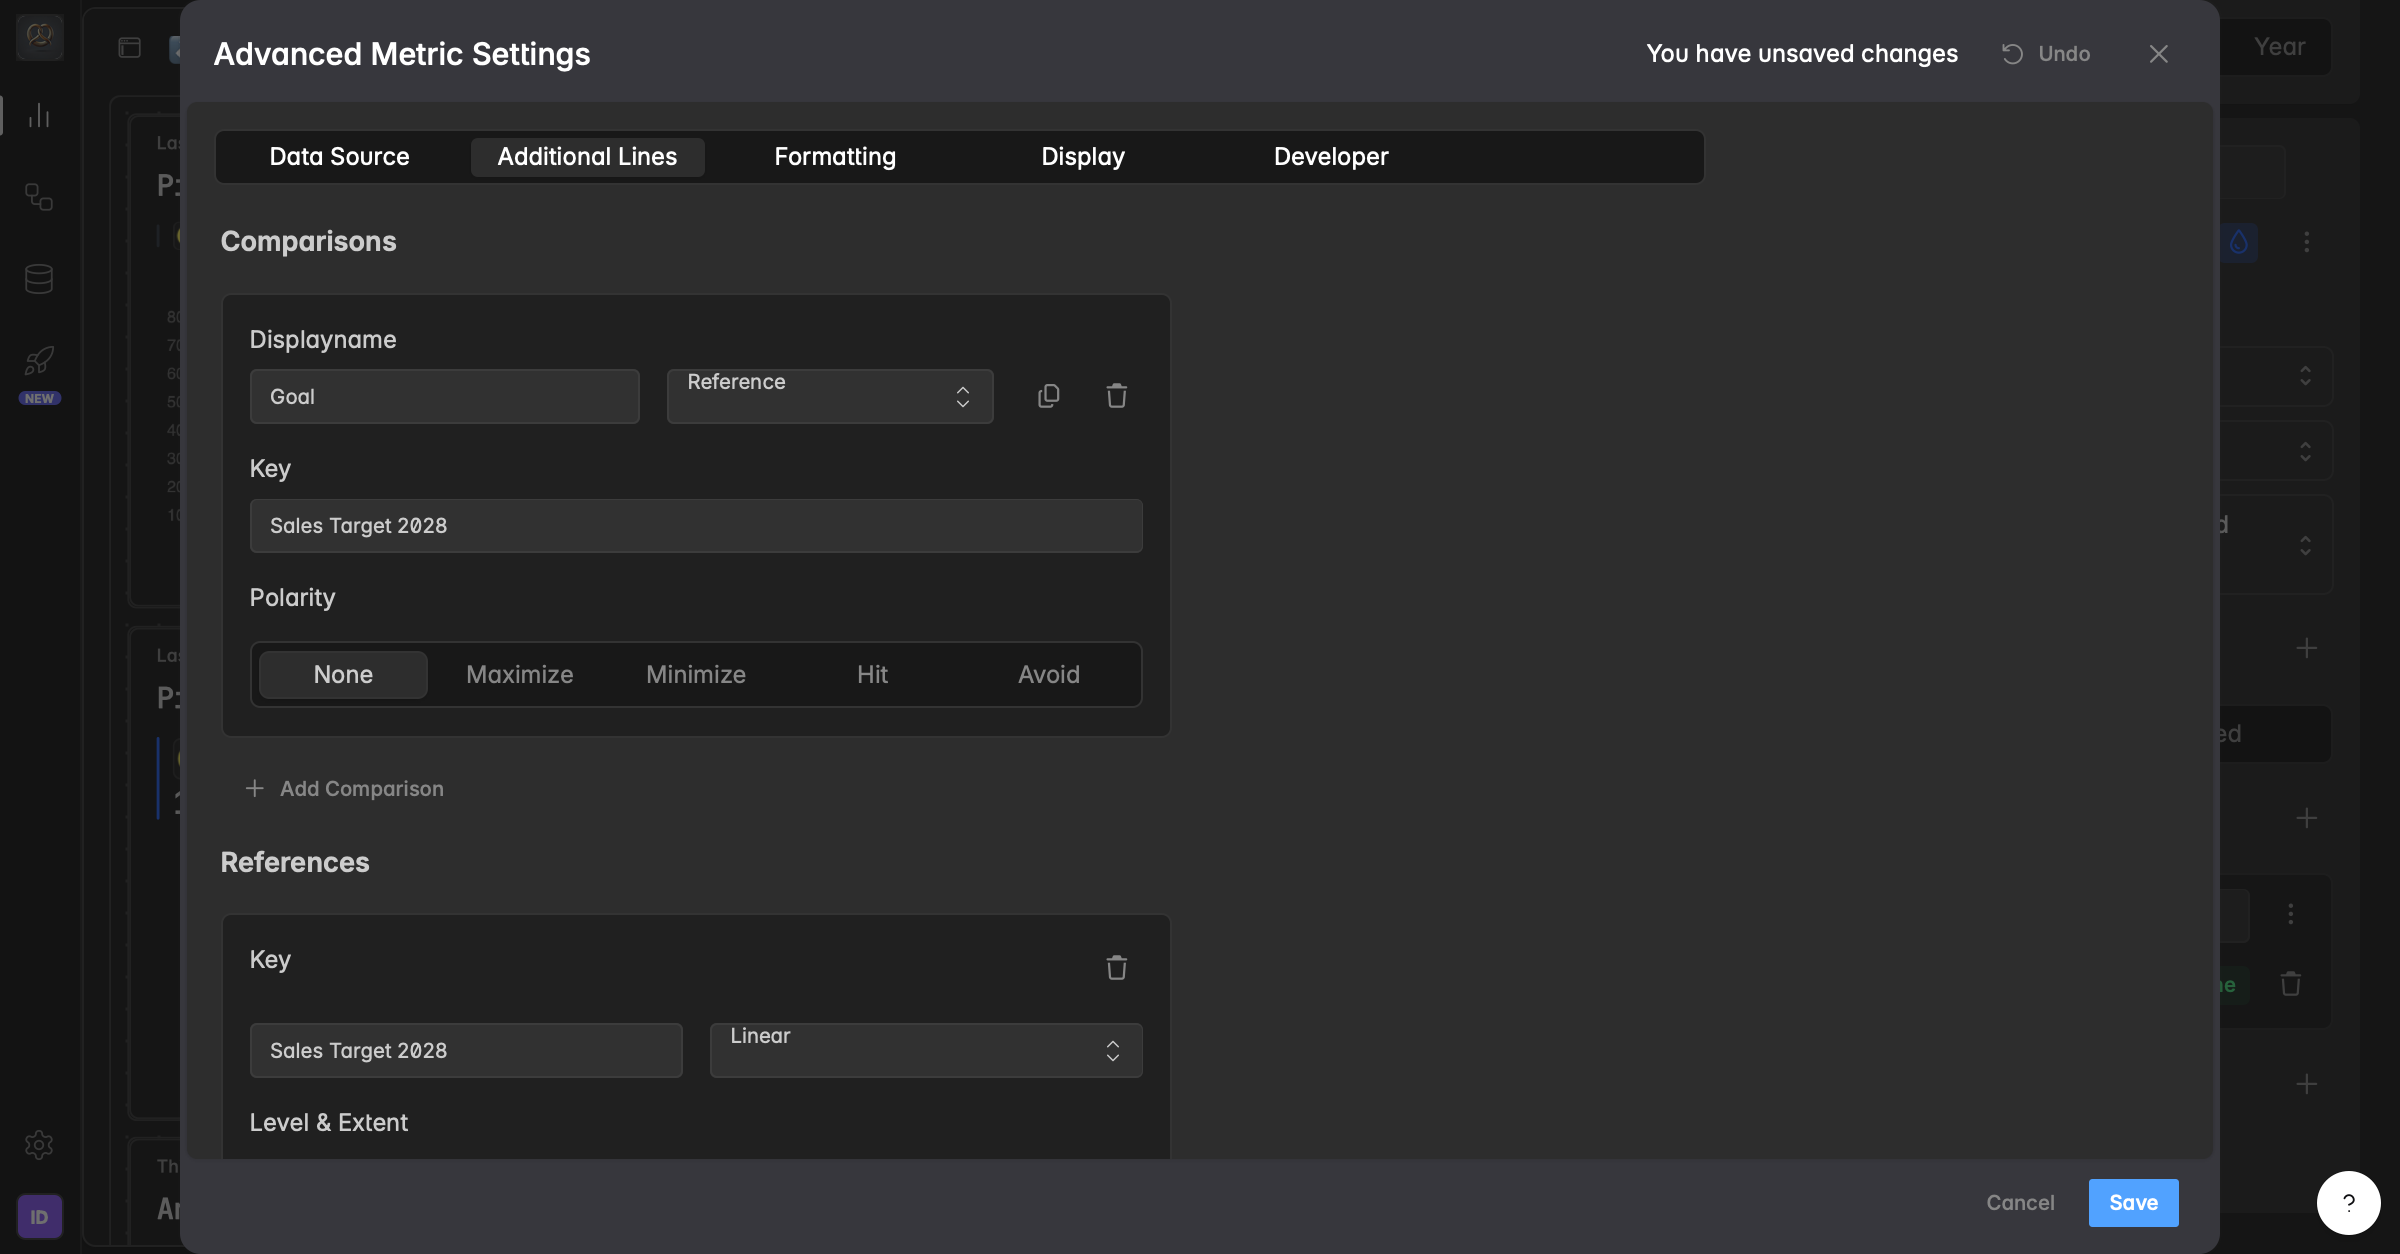
Reference (Target Comparison)
How it works:
Reference compares your current values against a defined reference line (for example, a target or expected value).
Connecting to Reference Lines:
You can add reference lines in the same configuration window, just below the Comparisons section. Look for the References section.
To connect a comparison to a reference line:
Open your Reference Line Editor.
Find the Reference Key field, which is a free text field where you can name your reference (e.g., "Monthly Budget", "Sales Target 2028").
Use this exact key name when selecting your Reference Key in the comparison settings.
The key can be whatever you choose to name it, as long as it matches between your reference line and your comparison configuration.
When to use it:
Use this to see if you are on track with your goals (Actual vs. Plan).
Example:
You are analyzing the revenue for the current month.
Action: You select the Reference "Monthly Budget".
Comparison: Indicate automatically calculates the comparison for you. You can decide whether you want to maximize, minimize, hit, or avoid the reference line based on your performance goals.
How do I add and configure comparisons?
Open your dashboard.
Select your widget.
In the widget builder, scroll to the Comparisons section.
Click
+next to Comparisons to create a new one.Define a Display name (for example, Comparison year 1).
Open the Advanced Metric Settings panel by clicking on the three dots
⋮next to the Comparison display nameIn the Advanced Metric Settings choose the Comparison type: Period over Period, Like for Like or Reference.
(Optional) Adjust the Multiplier if you want to offset or scale the compared period (e.g., compare 2 or 3 years back).
Define Polarity to specify how Indicate interprets performance:
Maximize → Higher values are better (e.g., Revenue, Users).
Minimize → Lower values are better (e.g., Errors, Bounce Rate).
Hit → Best when reaching a defined target.
Avoid → Best when staying below a defined limit.
Tolerance threshold: Define how much deviation from the target or previous value is acceptable and choose whether this threshold should be evaluated in percent (%) or absolute values.
Click
Saveto apply your configuration.
Your chart will now display comparison lines labeled (e.g., Comparison year 1, Comparison year 2, etc.) with distinct colors and styles.
If preferred use the color indicator in the side bar to assign a custom color for each comparison line.
How do I manage a comparison in the widget designer?
Each comparison you add appears as a row in the widget designer with quick controls, so you do not need to open the Advanced Metric Settings for everyday changes:
Hide or show it. Click the small ghost icon to ghost the comparison. It is hidden from the chart immediately and its settings stay saved. Click the ghost again to show it.
Change its color. Click the small color droplet next to the comparison and pick a color.
Read its settings at a glance. Labels on the row summarize the key settings, for example the type (Period over Period), the polarity (such as Maximize), and the display name.
Delete it. Click the bin icon to remove the comparison.
For everything else (comparison type, multiplier, tolerance), open the three dots ⋮ Advanced Metric Settings.
Troubleshooting
My comparison line isn't showing.
The compared period needs data. A Like for Like comparison draws nothing if there is no data in the previous year or quarter for your selected range.
The comparison values look wrong.
Check the Comparison type and Multiplier. Period over Period steps back by your selected range multiplied by the multiplier; Like for Like jumps to the same dates in a past scope.
My Reference comparison shows nothing.
The Reference Key in the comparison must exactly match the Key set on the reference line. Re-check the spelling in both places.
I clicked + next to Comparisons and a comparison appeared on its own.
Clicking the + next to Comparisons immediately adds a default Period over Period comparison. That is expected. To change anything (comparison type, multiplier, polarity, tolerance), open the three dots ⋮to reach the Advanced Metric Settings.
My comparison is comparing to the wrong period, not the same time last year.
A very common mix-up is using Period over Period when you actually want Like for Like. Period over Period steps back by your exact selected range (for example the previous 7 days), so it never lands on the same calendar dates a year ago. For year-over-year or seasonal comparisons, choose Like for Like: it jumps to the identical date range in a past scope (for example Oct 8 to Oct 14 of last year) and accounts for calendar shifts. Set the type in the three dots ⋮ Advanced Metric Settings.
Was this helpful?