
Grouping and perspective
Group by splits a metric by a dimension, Search in time by picks the date that decides the period, and Group by time sets the grain of the time axis.
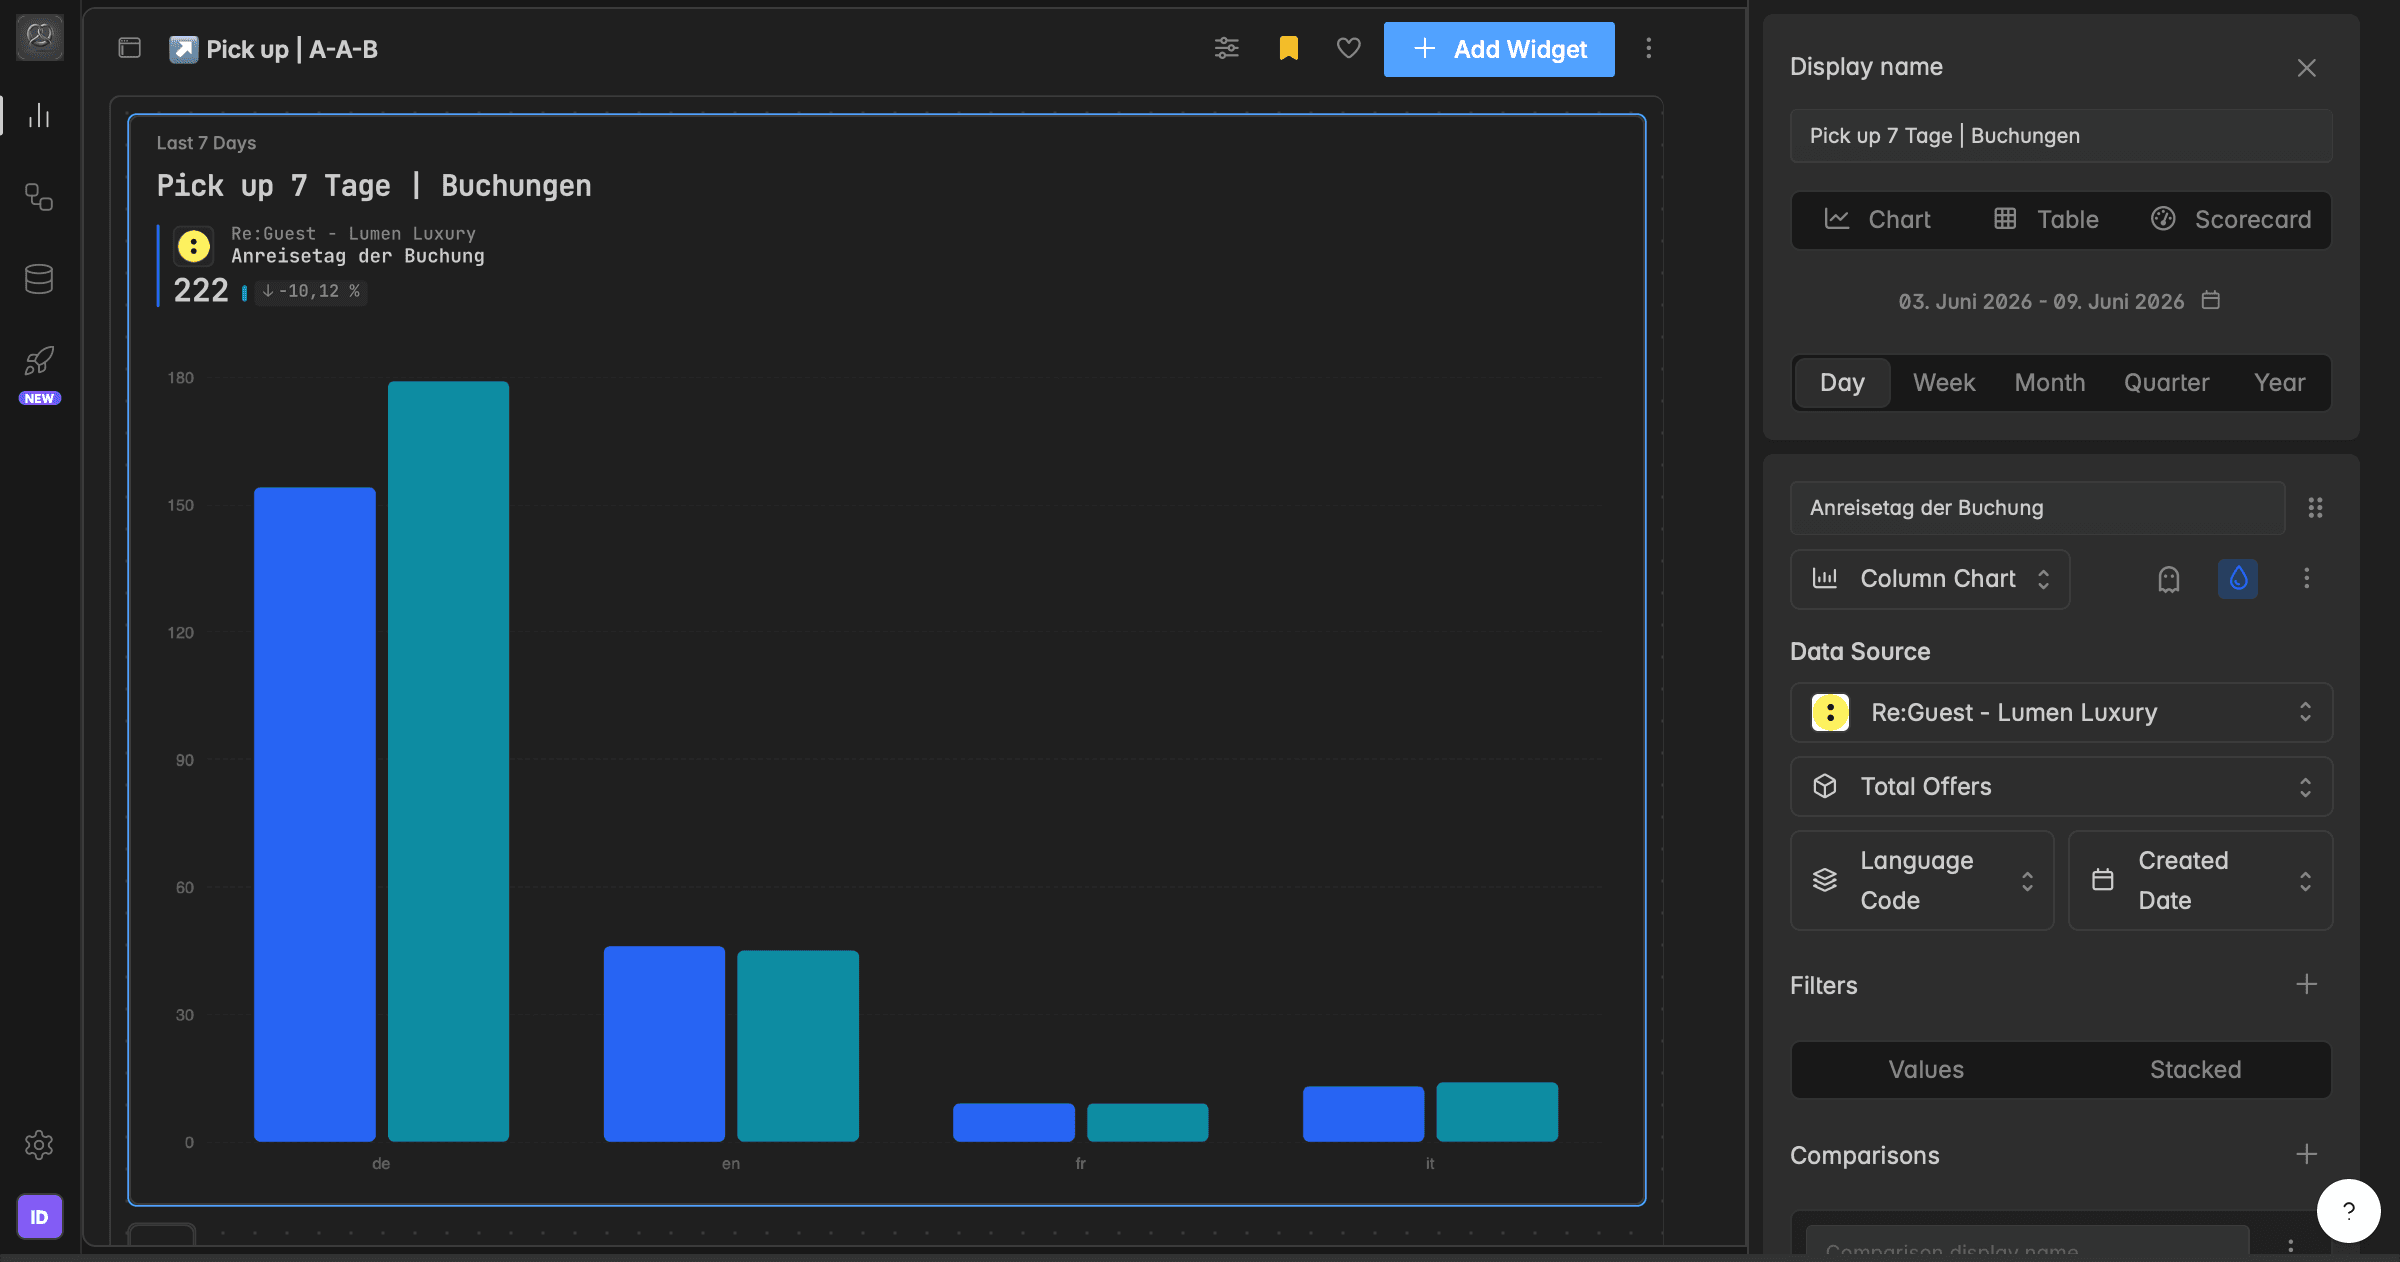
What are grouping and perspective?
Every series on a widget has three settings that decide how its records are arranged. All three are dimensions, but they do different jobs:
Group by splits the metric by a dimension, so the widget shows one series per value: one per channel, one per country, one per property. This is the grouping. It decides what you see.
Search in time by picks which date on each record decides the period it counts in: the day a request came in, or the day of the stay. This is the perspective. It decides which records are included in the time range.
Group by time sets how far apart the points on the time axis sit: one per Day, Week, Month, Quarter, or Year.
In short: the perspective chooses the slice of data, the grouping chooses how that slice is broken down, and the time grain chooses how fine the time axis is.
How do I group a series by a dimension?
Editing needs at least the User role.
Open the dashboard and click the name of the widget. The widget editor opens on the right.
Scroll to the series and click Group by.
Pick a dimension, for example
Channel. Only the dimensions the metric supports are listed. Type to search.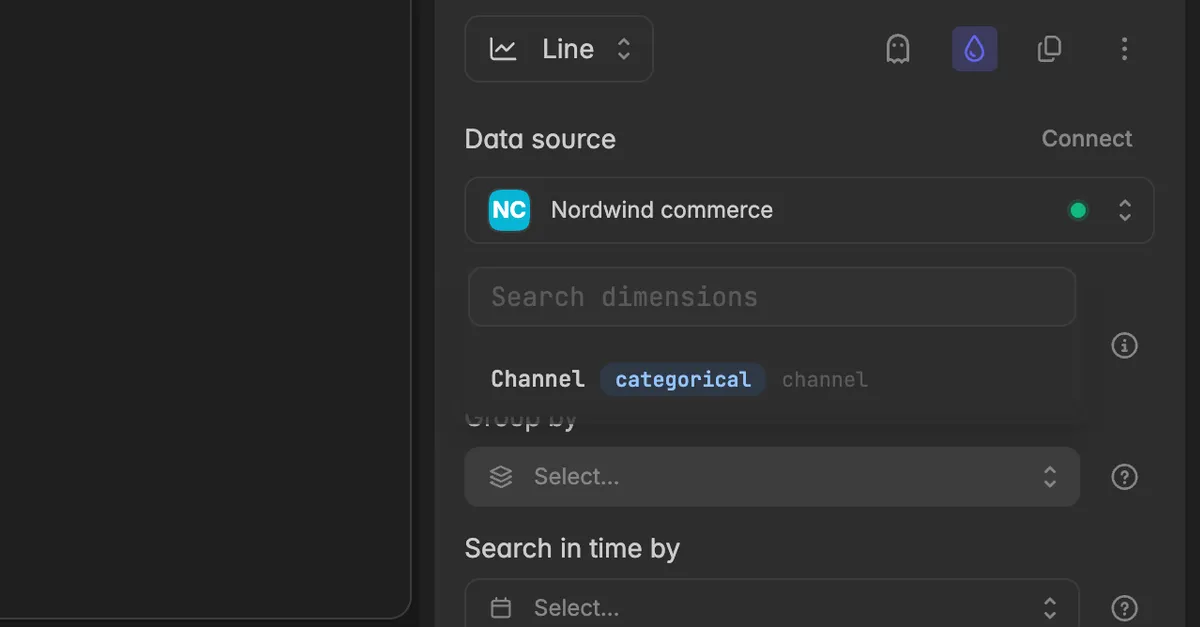
The chart now draws one series per value of the dimension, for example one line per channel, each with its own color. Clear the field to go back to one line for the whole metric.
Grouping does not change which records are included. It only changes how they are shown. To limit or sort the groups, for example to the top 5 channels, use Ranking.
How do I choose the perspective?
In the widget editor, scroll to the series and click Search in time by.
Pick the date dimension that should decide the period, for example
Arrival dateorCreated date. The?icon next to the field explains it.
The time range of the widget is then applied to that date. With Last 7 days and Search in time by set to Arrival date, the widget shows the bookings of guests arriving in the last 7 days, no matter when they booked. With Created date, it shows the bookings made in the last 7 days, no matter when the guests arrive.
Note: A series draws nothing until Search in time by is set. The editor shows the banner One series has no data behind it yet with Missing Search in time by until you pick one.
How do I set the time grain?
In the widget editor, under Group by time at the top, click Day, Week, Month, Quarter, or Year.
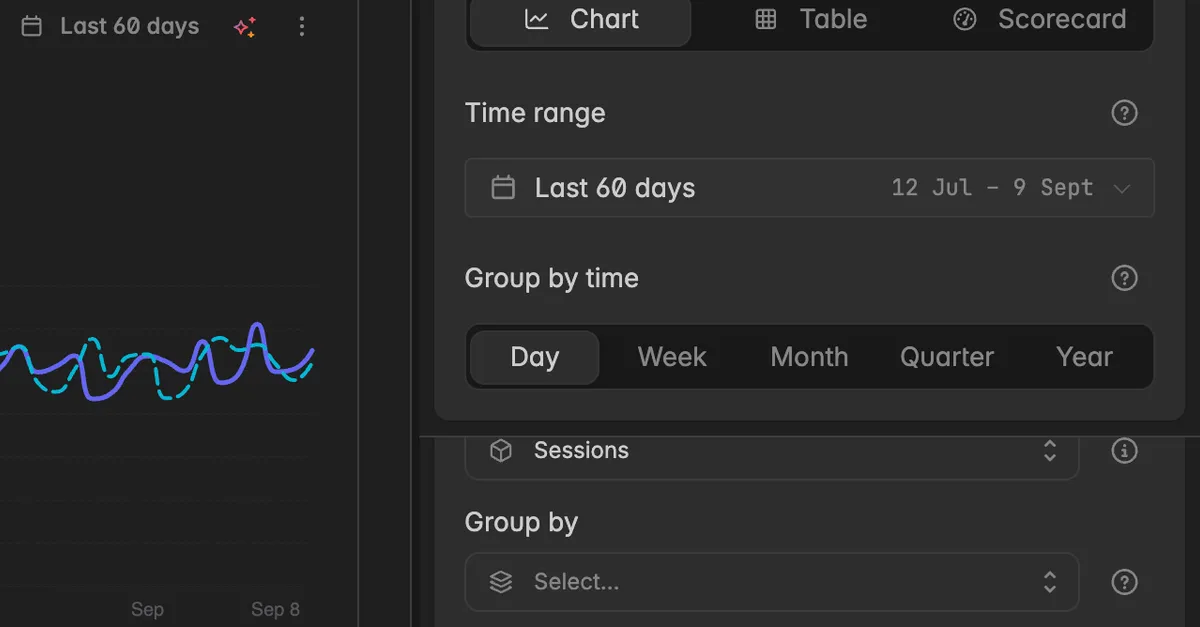
The widget re-buckets its points, so a 60-day range becomes 60 points by day or 9 points by week. The grain is saved with the widget and applies to every series on it.
Change the grain just for you
Once a series is grouped by a date dimension, the widget card on the dashboard shows the grain next to its time range. Click it to switch the grain for your own view. The tooltip tells you whether the grain is saved on this widget or your view only, not saved. Click Back to the widget's grouping in the menu to undo it. Like the time range on the card, this is stored in your browser and does not change what others see. See Edit widget calendar.
How do grouping and perspective work together?
Take the metric Bookings with a time range of Last 7 days:
| Group by | Search in time by | The widget shows |
|---|---|---|
Country |
Created date |
The bookings made in the last 7 days, one bar per country. |
Arrival date |
Created date |
The bookings made in the last 7 days, arranged by when the guests arrive. Answers: of the bookings created this week, when are they arriving? |
Created date |
Arrival date |
The bookings of guests arriving in the last 7 days, arranged by when they were made. Answers: of the guests arriving this week, when did they book? |
Troubleshooting
The chart shows one line although I grouped by channel
The grouped series is drawn once per value only if the dimension has values in the selected range. Widen the Time range or check the filter on the series.
The Group by field may be empty on a second series. Grouping is per series.
The numbers changed after I switched Search in time by
- That is expected. The time range now applies to a different date on each record, so different records fall into it. Pick the perspective that matches the question you are asking.
Group by time has no effect
- The grain only applies to series that are grouped by a date dimension. A pie chart by channel has no time axis to re-bucket.
The grain on the widget card is missing
- The control only appears when at least one series on the widget runs over time. It is hidden on widgets that are grouped by a category only.
Was this helpful?