Filter data
Learn how to refine your data visualizations by adding filters to include or exclude specific values based on dimensions like language, channel, or date.

Why filters matter
Filters let you refine your data by including or excluding specific values to visualize your widget.
You can filter by any available dimension, such as Language Code, Channel, Country, or Date.
Filters can be simple (e.g., Language Code = de) or advanced, combining multiple conditions and logic groups for complex queries.
They allow you to:
Focus on a specific segment, such as one language or channel.
Exclude irrelevant data.
Create custom metrics based on filtered subsets (e.g., only mobile traffic and/or only bookings from Germany).
Build dashboards that adapt to different analytical perspectives.
Each metric can have its own filter configuration.
You can combine multiple conditions with logical operators such as ALL (AND) or ANY (OR).
Each group can contain multiple conditions and subgroups.
How do I add and configure filters?
Open your dashboard.
Select the widget where you want to add a filter.
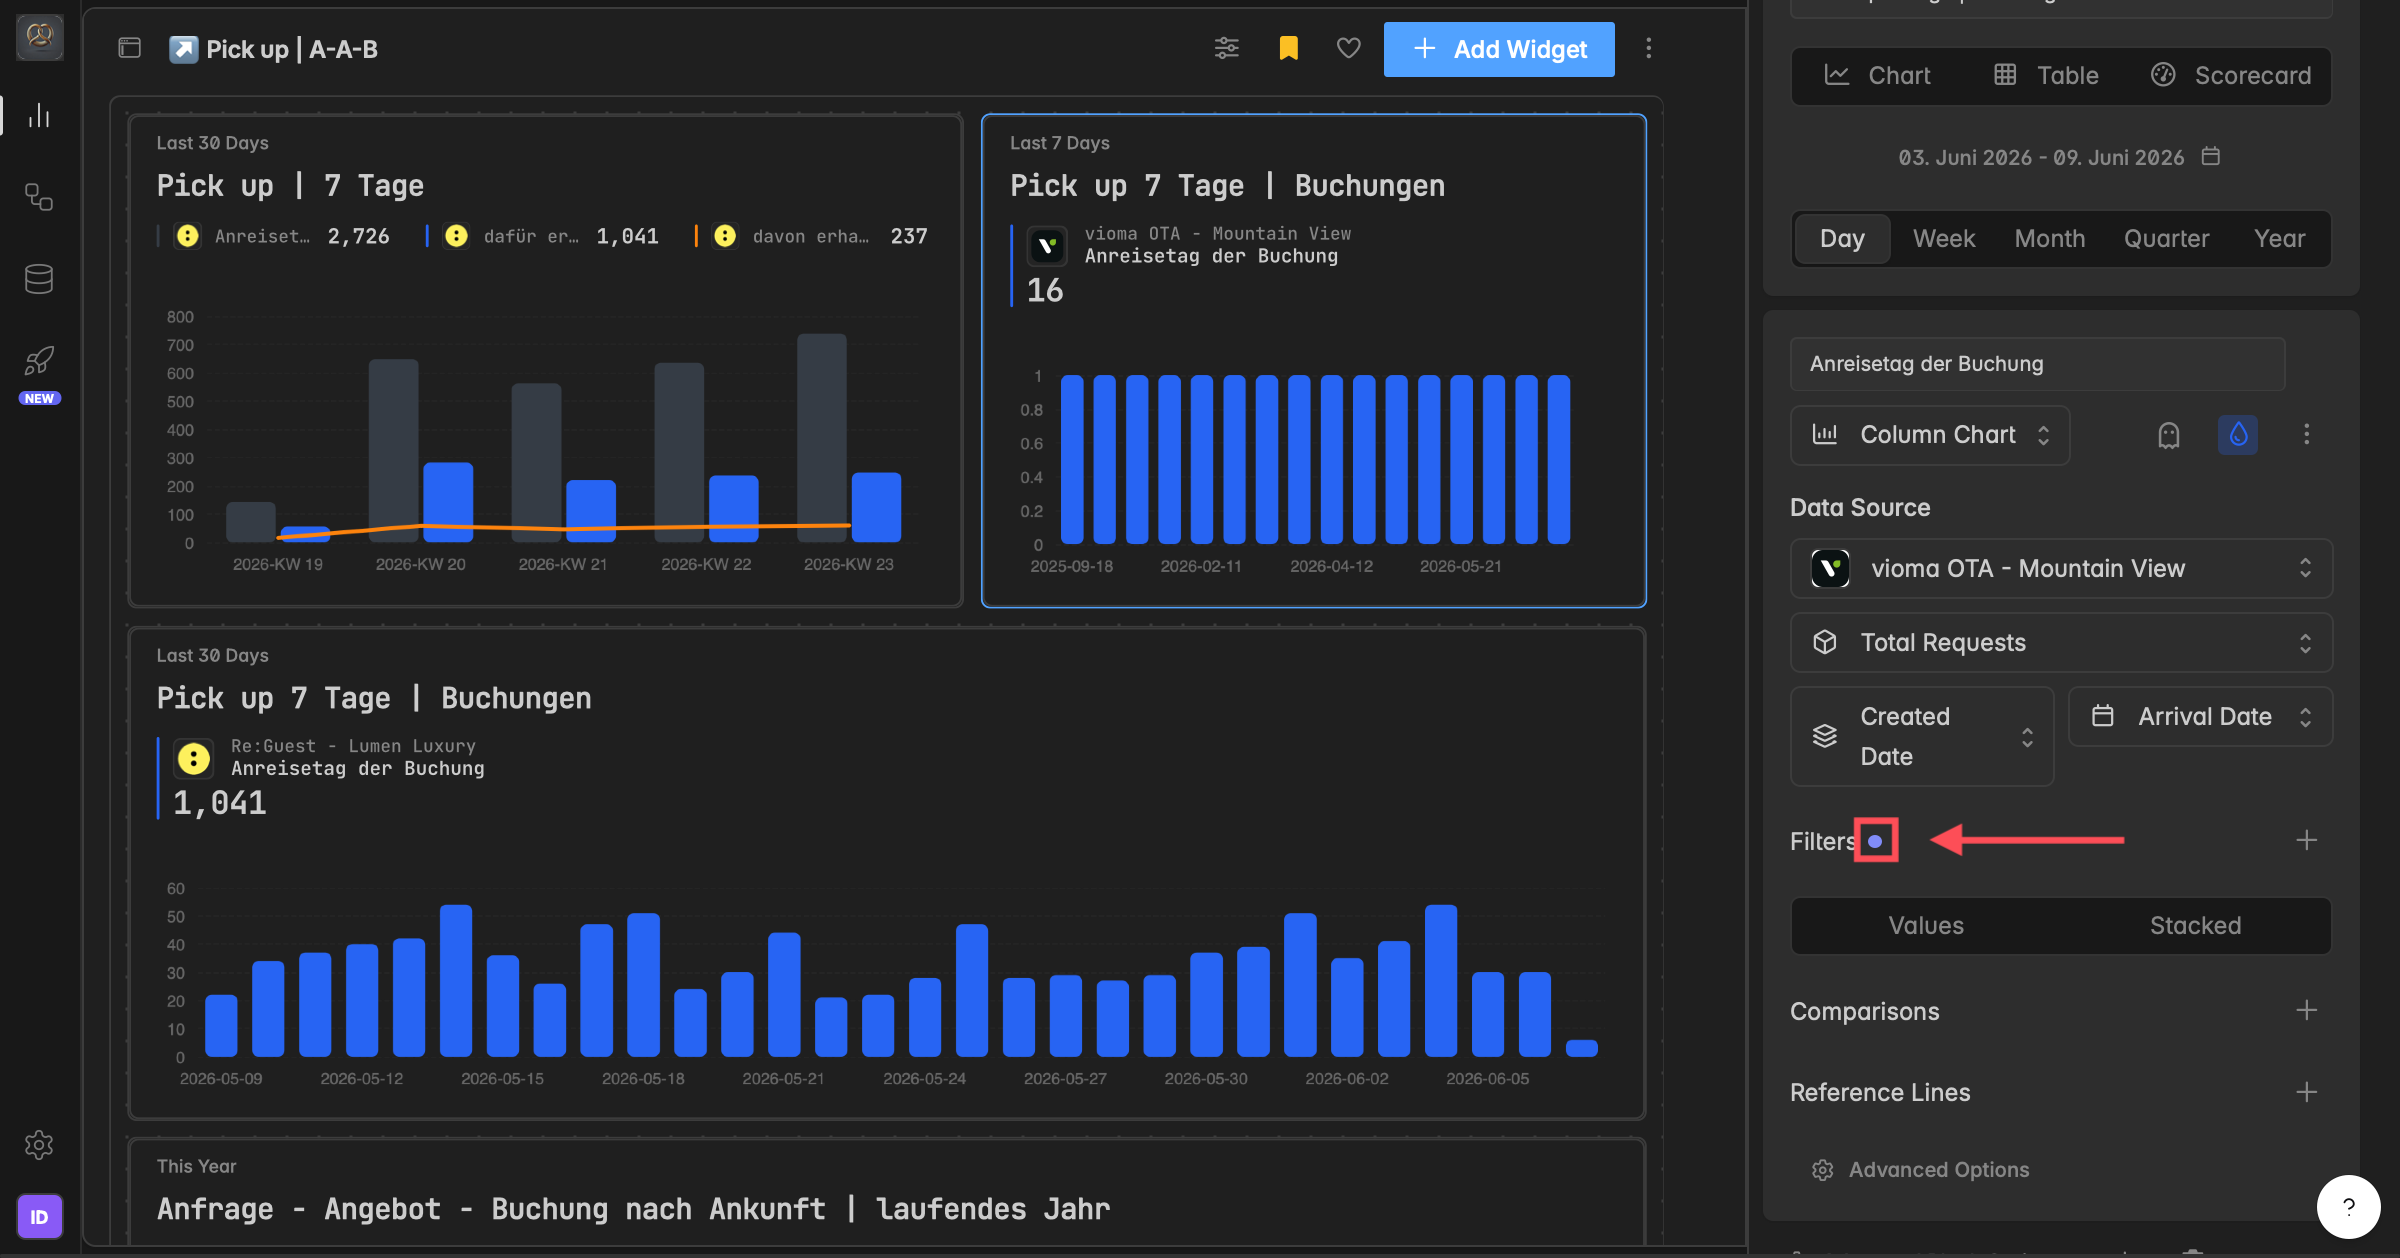
In the widget builder, scroll to the Filters section.
Click
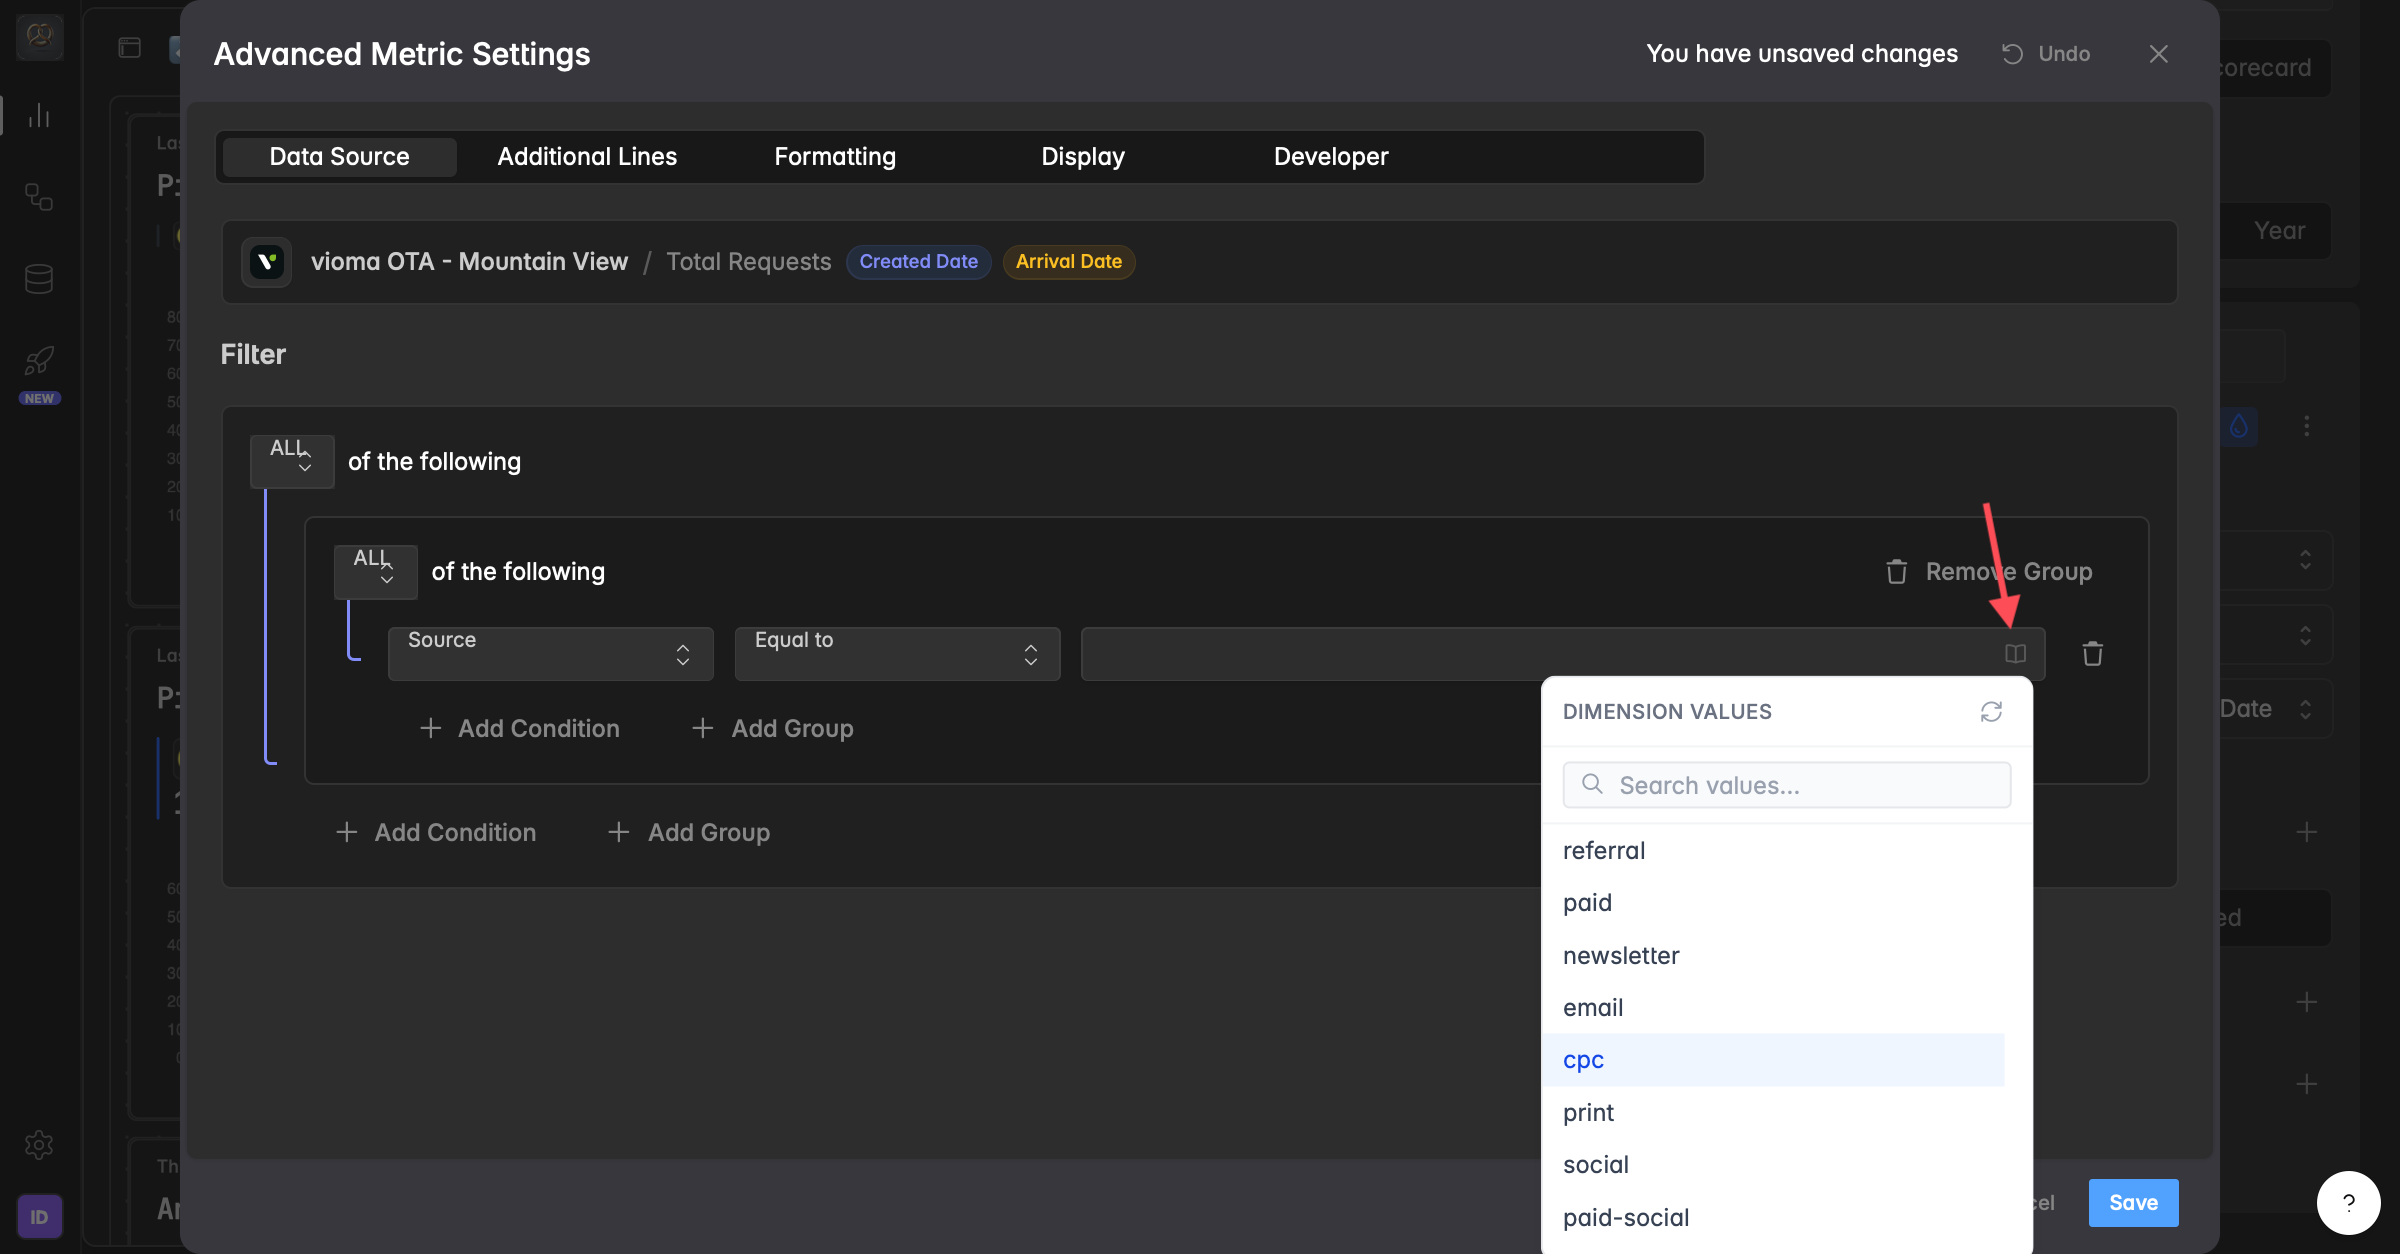
+to open the Advanced Metric Settings.Choose the dimension you want to filter by (e.g., Source, Language Code).
Select an operator (e.g., Equal to, Not equal to, Lower than, Greater than / Equal to, Contains).
Enter the value you want to use (e.g., de or Facebook). Click the little booklet in the search field in the dropdown to quickly find a dimension value.
Repeat the process to add additional filters.
Click Save to apply.
The chart preview updates immediately, showing only the filtered data.
What do the filter operators mean?
When you add a condition, the operator decides how the value is matched:
Equal to: keeps only rows that exactly match the value you enter (for example Country is Germany).
Not equal to: keeps everything except that value (for example exclude Germany).
Lower than: keeps values strictly below the number or date you enter (for example Sessions below 100).
Lower than / Equal to: keeps values below or exactly equal to it (for example Sessions of 100 or less).
Greater than: keeps values strictly above the number or date (for example Revenue above 1000).
Greater than / Equal to: keeps values above or exactly equal to it (for example Revenue of 1000 or more).
Contains: keeps rows whose text includes what you enter, even partially (for example Page path contains blog).
Use Lower than and Greater than with numeric or date dimensions, and Contains with text dimensions.
How do I find a dimension to filter by?
When selecting a dimension for a filter condition, click the small booklet icon to open a searchable dropdown of dimension values. Type any part of the dimension name to quickly find and select the right field. If you are filtering by date, you need to type the date manually using the correct format, usually in English order: YYYY-MM-DD.
How do I know a widget has an active filter?
When a filter is active on a widget, a small pulsing dot appears on the widget’s settings icon. This visual indicator makes it easy to see at a glance which widgets are currently filtered, without opening the widget builder.
Filters are saved with the widget.
They stay active when you change the metric/KPI or data source within the same widget, so you can quickly switch to the same metric for a different entity, or to another metric in the same data source, without rebuilding the widget from scratch.
Troubleshooting
My filter returns no data.
Check that the value matches exactly, including upper and lower case.
Language Code = DEandLanguage Code = deare treated as different values.
I can't find the dimension I want to filter by.
Filters only offer dimensions that exist in the widget's data source. If a dimension is missing, it is not part of that source.
My widget shows "No series configured" after I changed the metric/KPI or data source.
The filter you set earlier is still active and no longer matches the new metric, so nothing can be shown. The blue pulsing dot in the widget designer next to the word Filters tells you a filter is still on. Remove or adjust the filter, and the metric is shown again.
Was this helpful?