
Home page
What the Home page of a space shows: the onboarding, the home dashboard and who can set it, data sources that need attention, invitations awaiting you, and shortcuts.
What is the Home page?
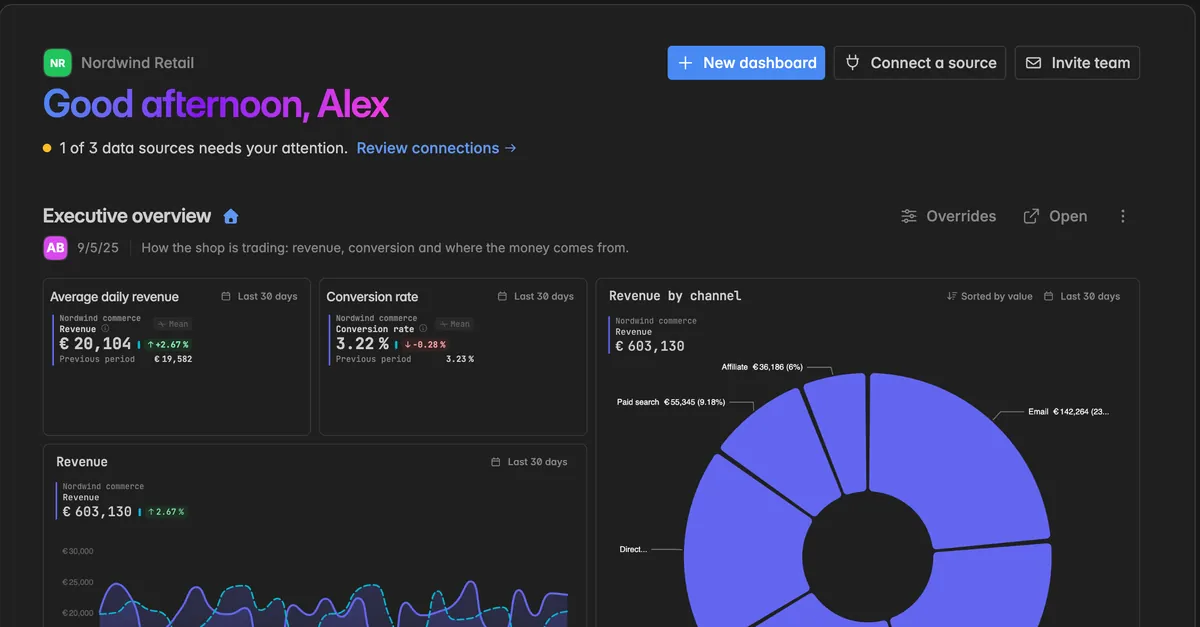
The Home page is the first thing you see when you open a space. It greets you by name, tells you in one line whether your data sources are healthy, and shows the dashboard your team agreed to start on. Below that it lists what needs your attention, what is waiting for your decision, and where to go next.
Open it at any time with Home at the top of the left sidebar under Analytics.
The header holds three buttons. Which ones you see depends on your role:
New dashboard: opens the create page, see Create a dashboard. Needs at least the User role.
Connect a source: opens the dialog to connect a new data source. Admins only.
Invite team: opens
Settings→Team→Members. Admins only.
Right below the greeting, a status line sums up your data sources: All 3 data sources are in good shape, 1 of 3 data sources needs your attention with a link to Review connections, 2 of 3 data sources are syncing right now, or No data connected yet.
Getting started: the onboarding
A new space starts with an onboarding that walks you through the three things a space needs. It appears on the Home page in two forms.
The full card
As long as the space has no data source, no dashboard, and no Insight, the Home page shows the card Let's get your first dashboard up with three steps:
Connect your systems: your PMS, booking engine, channel manager or Google Analytics. Click the step to open the connect dialog. Admins only, other roles see the lock Admin only.
Create your first dashboard: describe what you want to see, or start from a template. Click Create a dashboard to open the create page, or Browse templates for the marketplace. Needs the User role, otherwise the lock reads Not available for your role.
Invite your team: everyone sees the same numbers. Click Invite people to open the members page. Admins only.
A finished step shows the badge Done.
The compact bar
Once the space has something, but not yet both a data source and a dashboard, the card shrinks to the bar Getting started with a progress line, for example 1 of 3 done, and buttons for the steps that are still open.
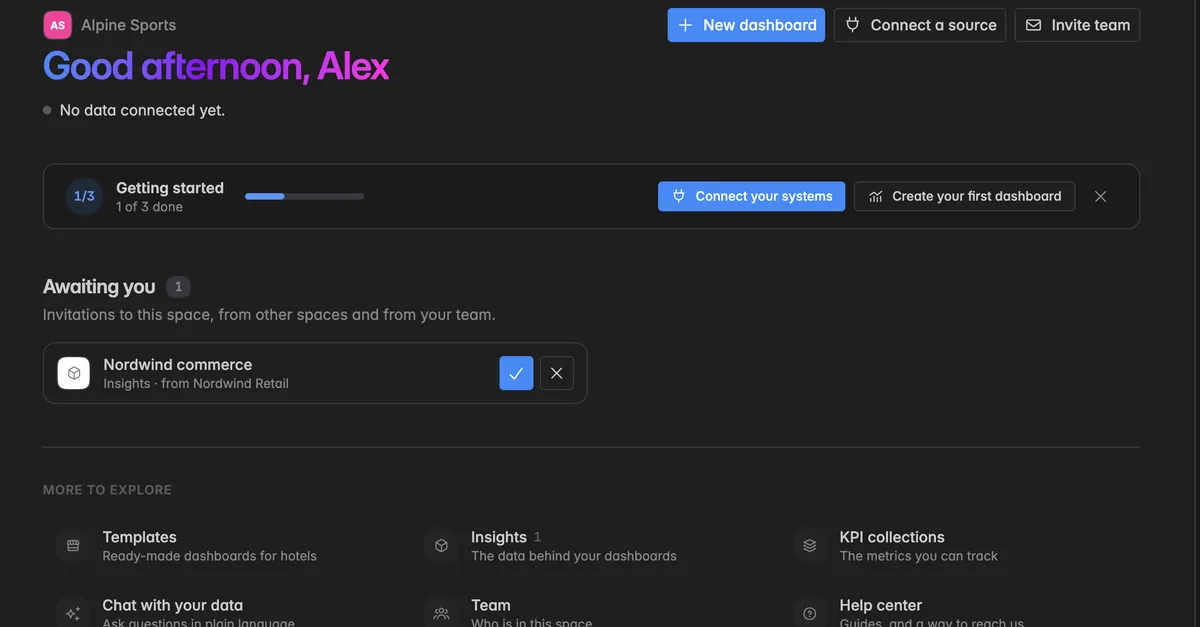
The bar disappears on its own as soon as the space has at least one connected data source and one dashboard. The team step is a bonus and does not hold it back. Click the x at the right end to hide the bar earlier. This only hides it for you in this browser.
The home dashboard
The home dashboard is the dashboard the whole space starts on. Everyone in the space sees it on the Home page the moment they arrive, read-only, with the time controls at hand. Nobody has to know which board to look for.
The dashboard itself is a normal dashboard from one of your projects. Setting it as home dashboard does not move or copy it, it only shows it on the Home page.
Who can set it
Choosing, changing, and removing the home dashboard requires the Admin role. Members with the User or Reader role see the home dashboard but cannot change it.
How do I set the home dashboard?
There are two ways.
Option 1: from the Home page
As long as no home dashboard is set, admins see the card Start everyone on the same numbers on the Home page. It only appears once the space has at least one dashboard.
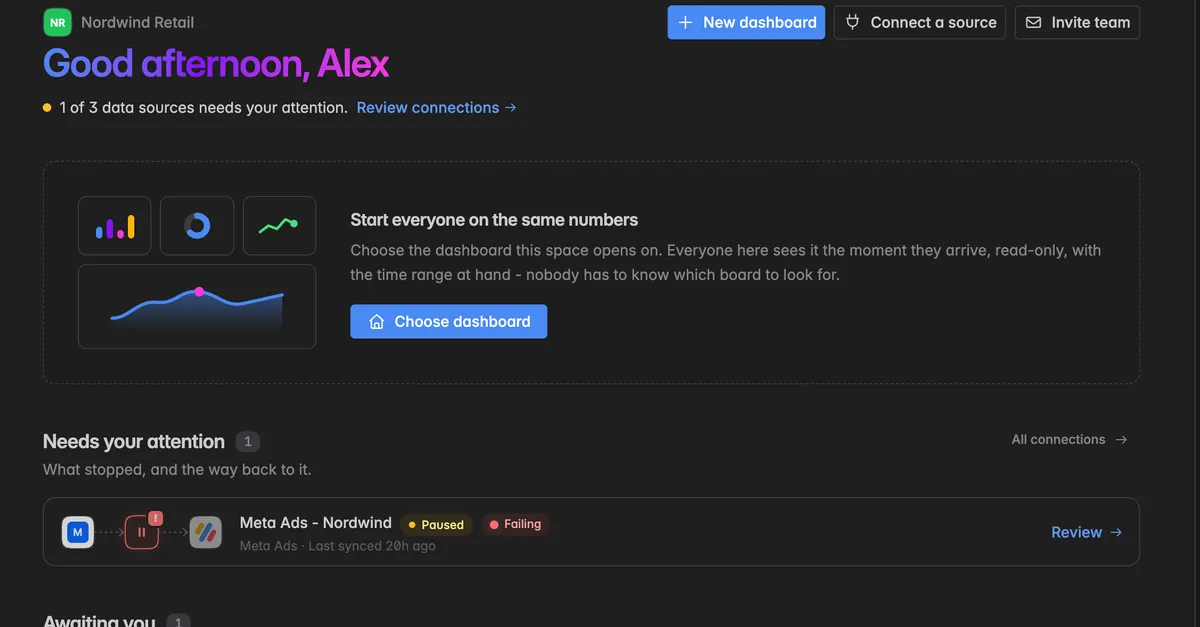
Click Choose dashboard.
In the dialog Choose the home dashboard, pick a dashboard from the list. The list is grouped by project, and you can search by name.
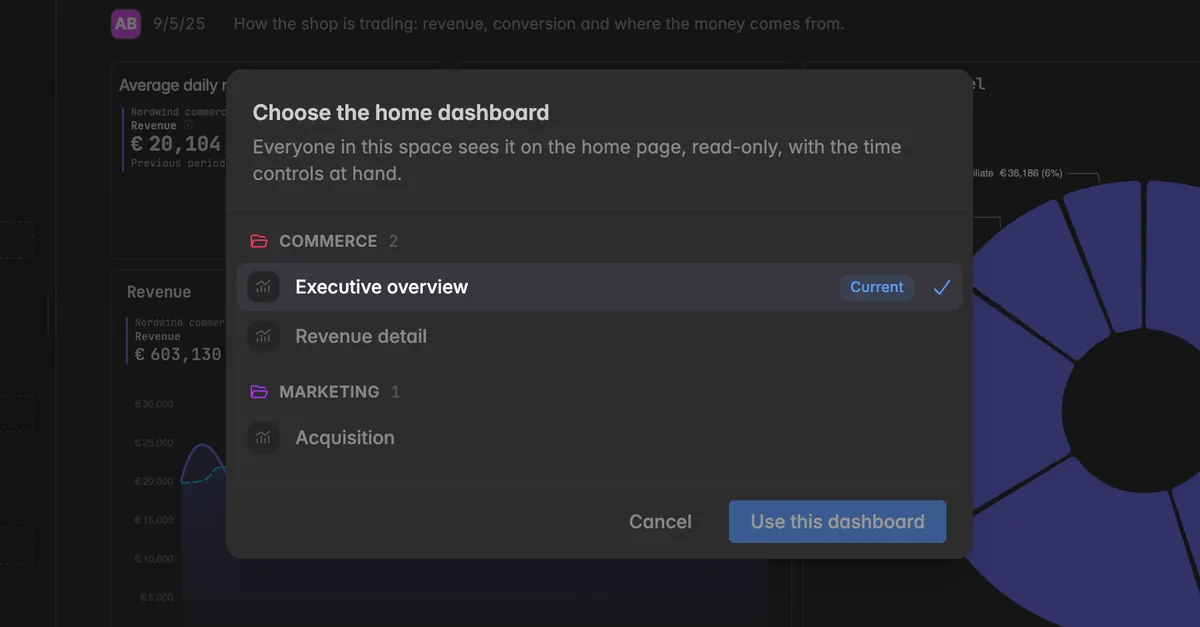
Click Use this dashboard. A toast confirms: "Executive overview" is now the home dashboard.
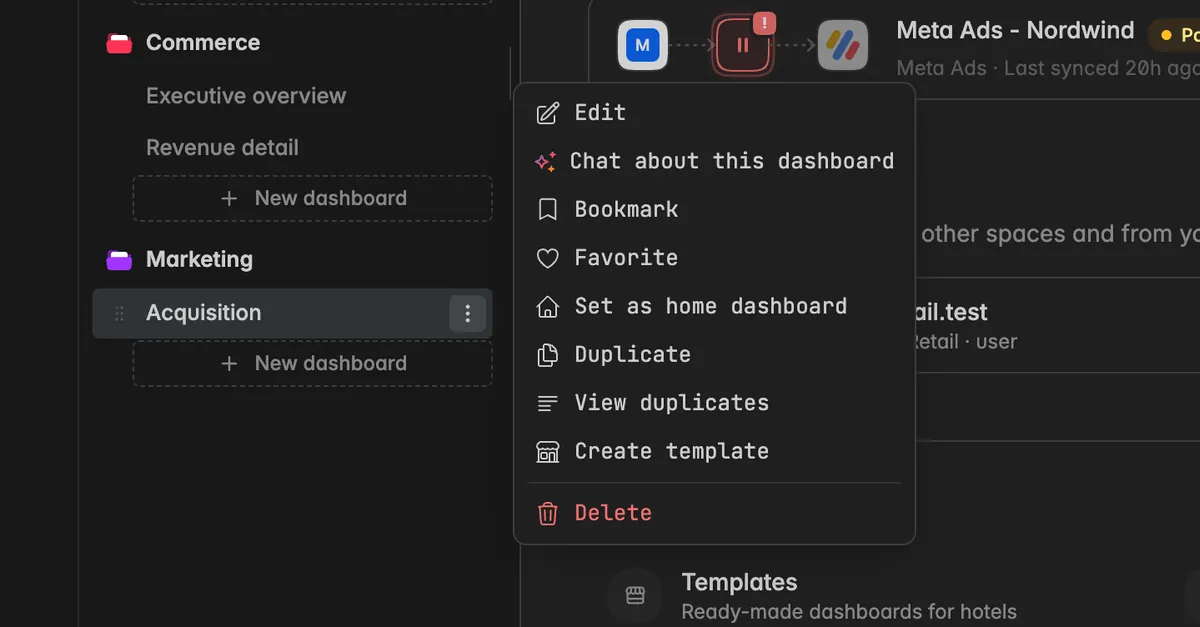
Option 2: from the sidebar or the dashboard
In the left sidebar, hover over the dashboard and click the
⋮icon that appears next to its name. Or open the dashboard and click the⋮icon at the top right of the toolbar.Select Set as home dashboard.
In the toolbar of the home dashboard, a house icon next to the name marks it: Shown on the home page for everyone in this space.
What can I change on the Home page?
Overrides: turn the switch on to set one time range for every widget, only for you and only in this view. Turn it off to go back to the widget's own ranges.
Open: opens the dashboard page, where you can edit widgets if your role allows it.
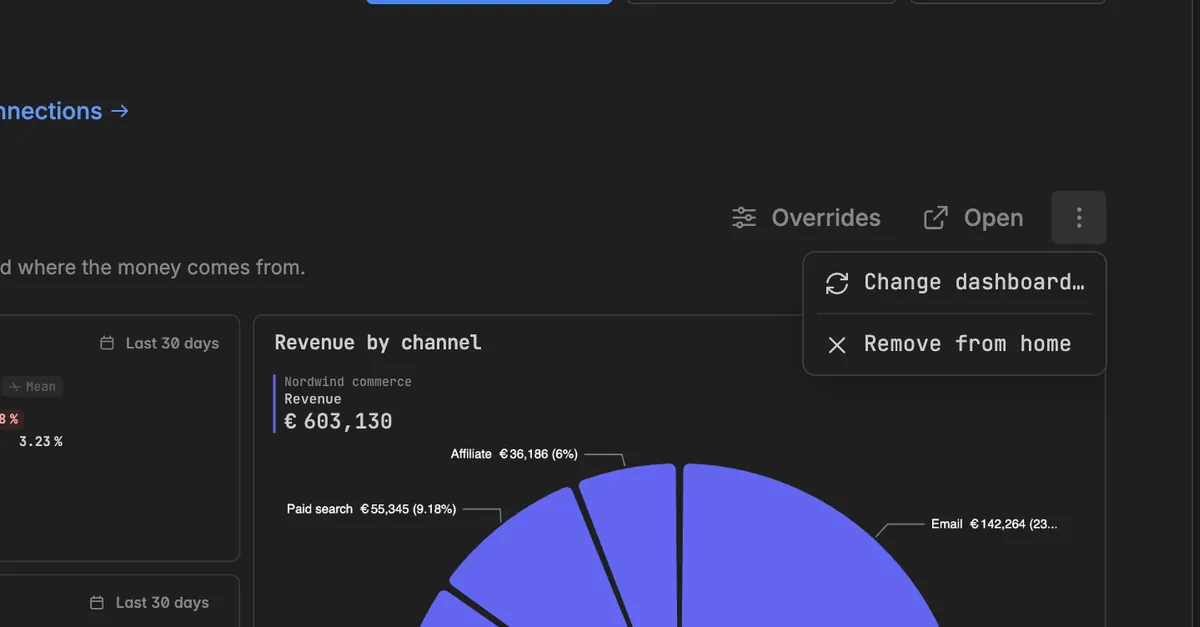
⋮ (Home dashboard options): admins can pick Change dashboard… to choose another one, or Remove from home to take it off the Home page. The dashboard itself is not deleted.
If the home dashboard was deleted or is no longer visible to you, admins see the notice The home dashboard is no longer available with the buttons Choose another and Remove. Other members do not see the section until an admin fixes it.
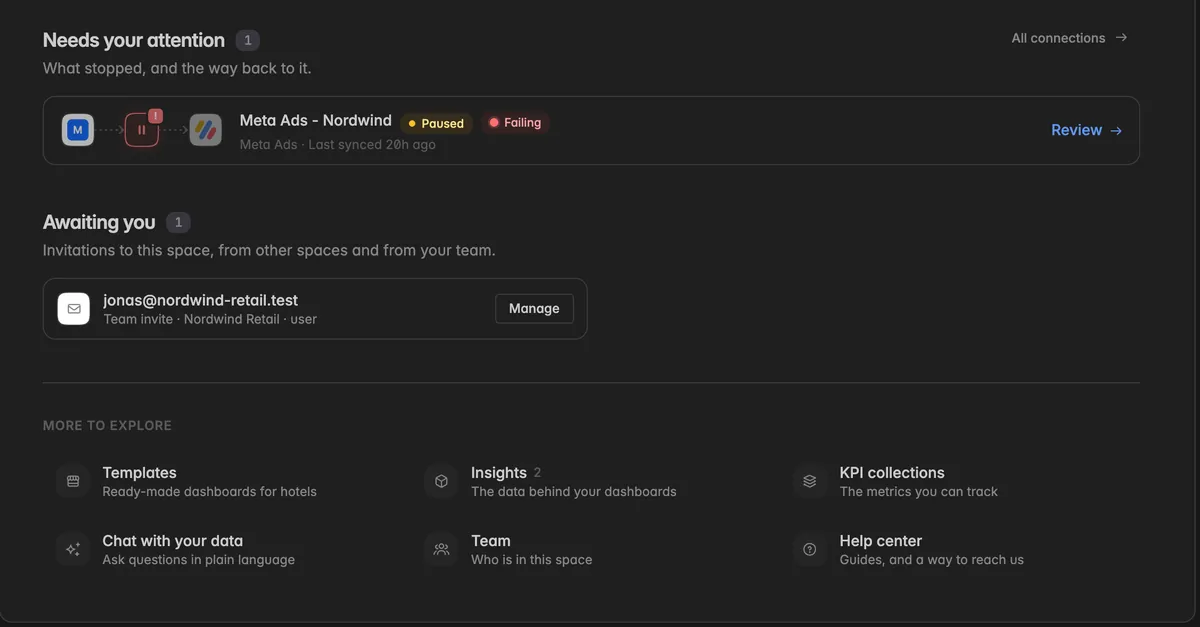
Needs your attention
This section lists the data sources that stopped delivering, and the way back to them. It only appears when at least one connection needs a hand.
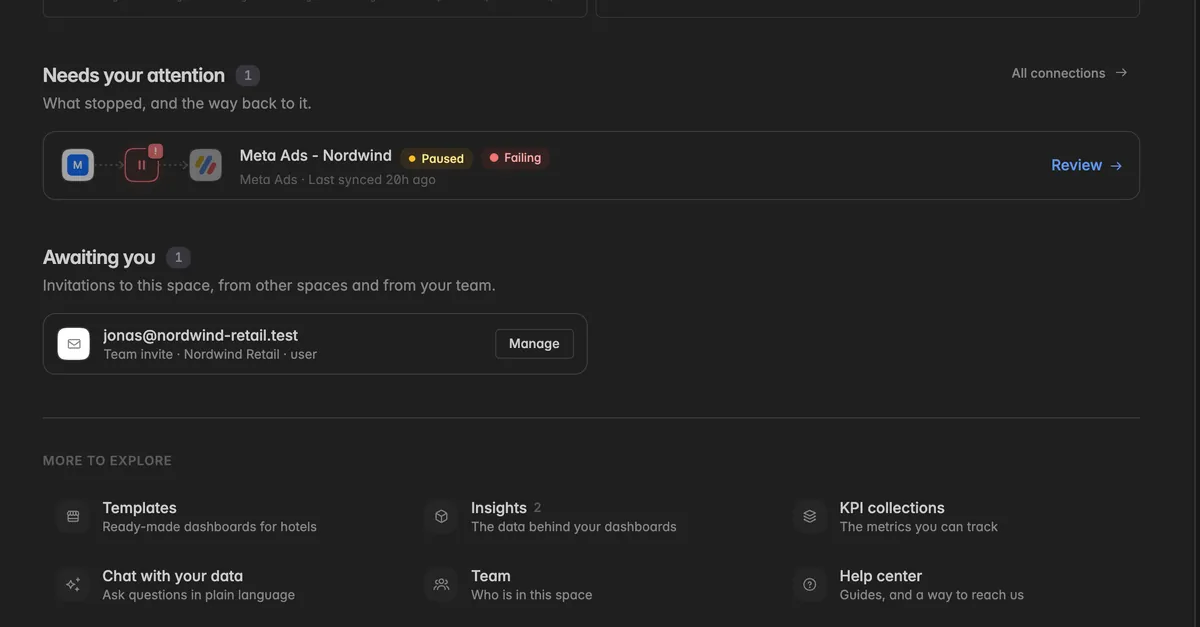
Each row shows the connection, its status badges such as Paused or Failing, the integration, and when it last synced. A connection ends up here when it is disconnected, paused by the system, failing, degraded, or flagged for review.
Reconnect appears when the credentials are the problem, for example an expired login. Click it to sign in again.
Review appears for every other cause. Click it to open the connection and see what happened.
The section shows up to 5 connections. If there are more, a line +N more need attention links to the full list. All connections at the top right opens Data sources → Connections.
Awaiting you
This section collects invitations that need a decision from your space. It only appears when there is at least one.
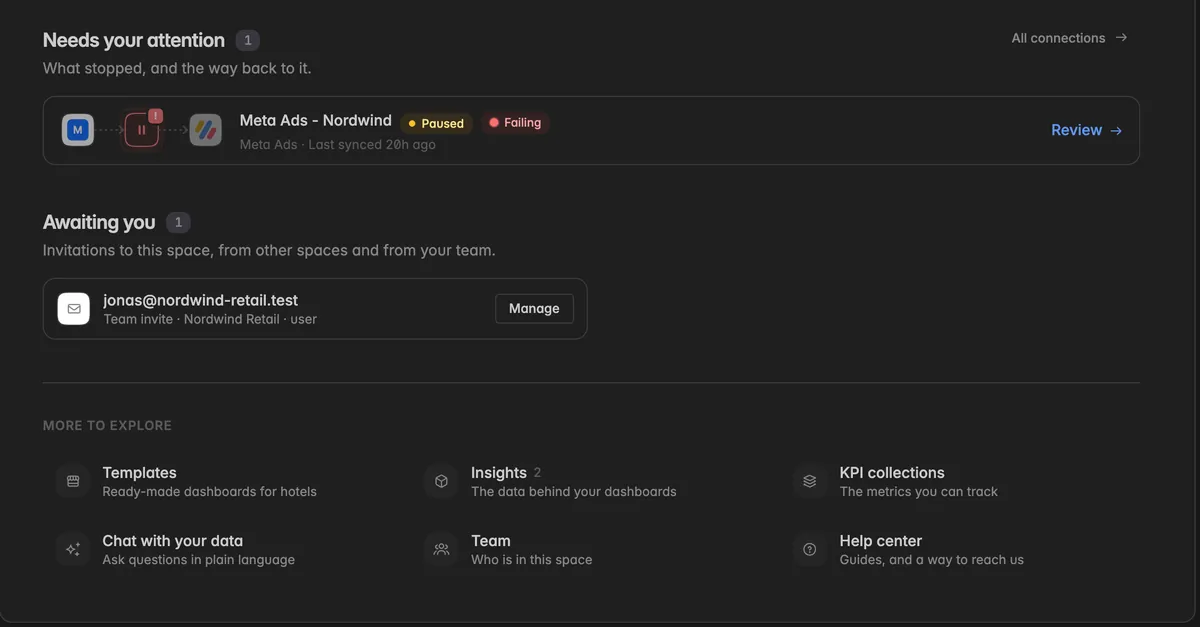
Three kinds of invitations land here:
Insights from another space, marked Insights · from [space]. Another space shared Insights with you. Click the check mark to accept or the
xto decline. Accepted Insights appear underData sources→Insightsand can be used in dashboards, but not changed.Template group invitations, marked Template group · from [space]. Another space invited you into a group to share private templates. Click Accept to join or Decline. See Templates Marketplace.
Team invites, marked Team invite · [space] · [role]. These are the people you invited who have not joined yet. Click Manage to open
Settings→Team→Members, where you can resend or cancel the invitation.
More to explore
The last section is a fixed set of shortcuts into the space:
Templates: ready-made dashboards for hotels, see Templates Marketplace.
Insights: the data behind your dashboards. The number next to it is how many Insights the space has.
KPI collections: the metrics you can track.
Chat with your data: ask questions in plain language.
Team: who is in this space.
Help center: this help center, and a way to reach us.
Troubleshooting
I don't see Choose dashboard or the options menu on the home dashboard
Setting the home dashboard requires the Admin role. Ask a space admin to set it.
The card Start everyone on the same numbers only appears once the space has at least one dashboard. Create one first.
The Getting started bar does not go away
It disappears once the space has at least one connected data source and at least one dashboard. Inviting the team is optional. Click the
xto hide it in this browser.If the bar comes back on another device, that is expected. Hiding it is stored per browser, not in your account.
Connect a source or Invite team is missing
Both buttons are for Admins only. Members with the User role see New dashboard only, members with the Reader role see none of the three.
The home dashboard is no longer available
The dashboard was deleted or moved out of your reach. An admin clicks Choose another to pick a new one, or Remove to clear the section.
A connection stays under Needs your attention after I fixed it
The list follows the sync status. After a reconnect, the next sync run has to finish before the badges change. Open the connection with Review to check the latest run.
Was this helpful?