
What is Data Studio?
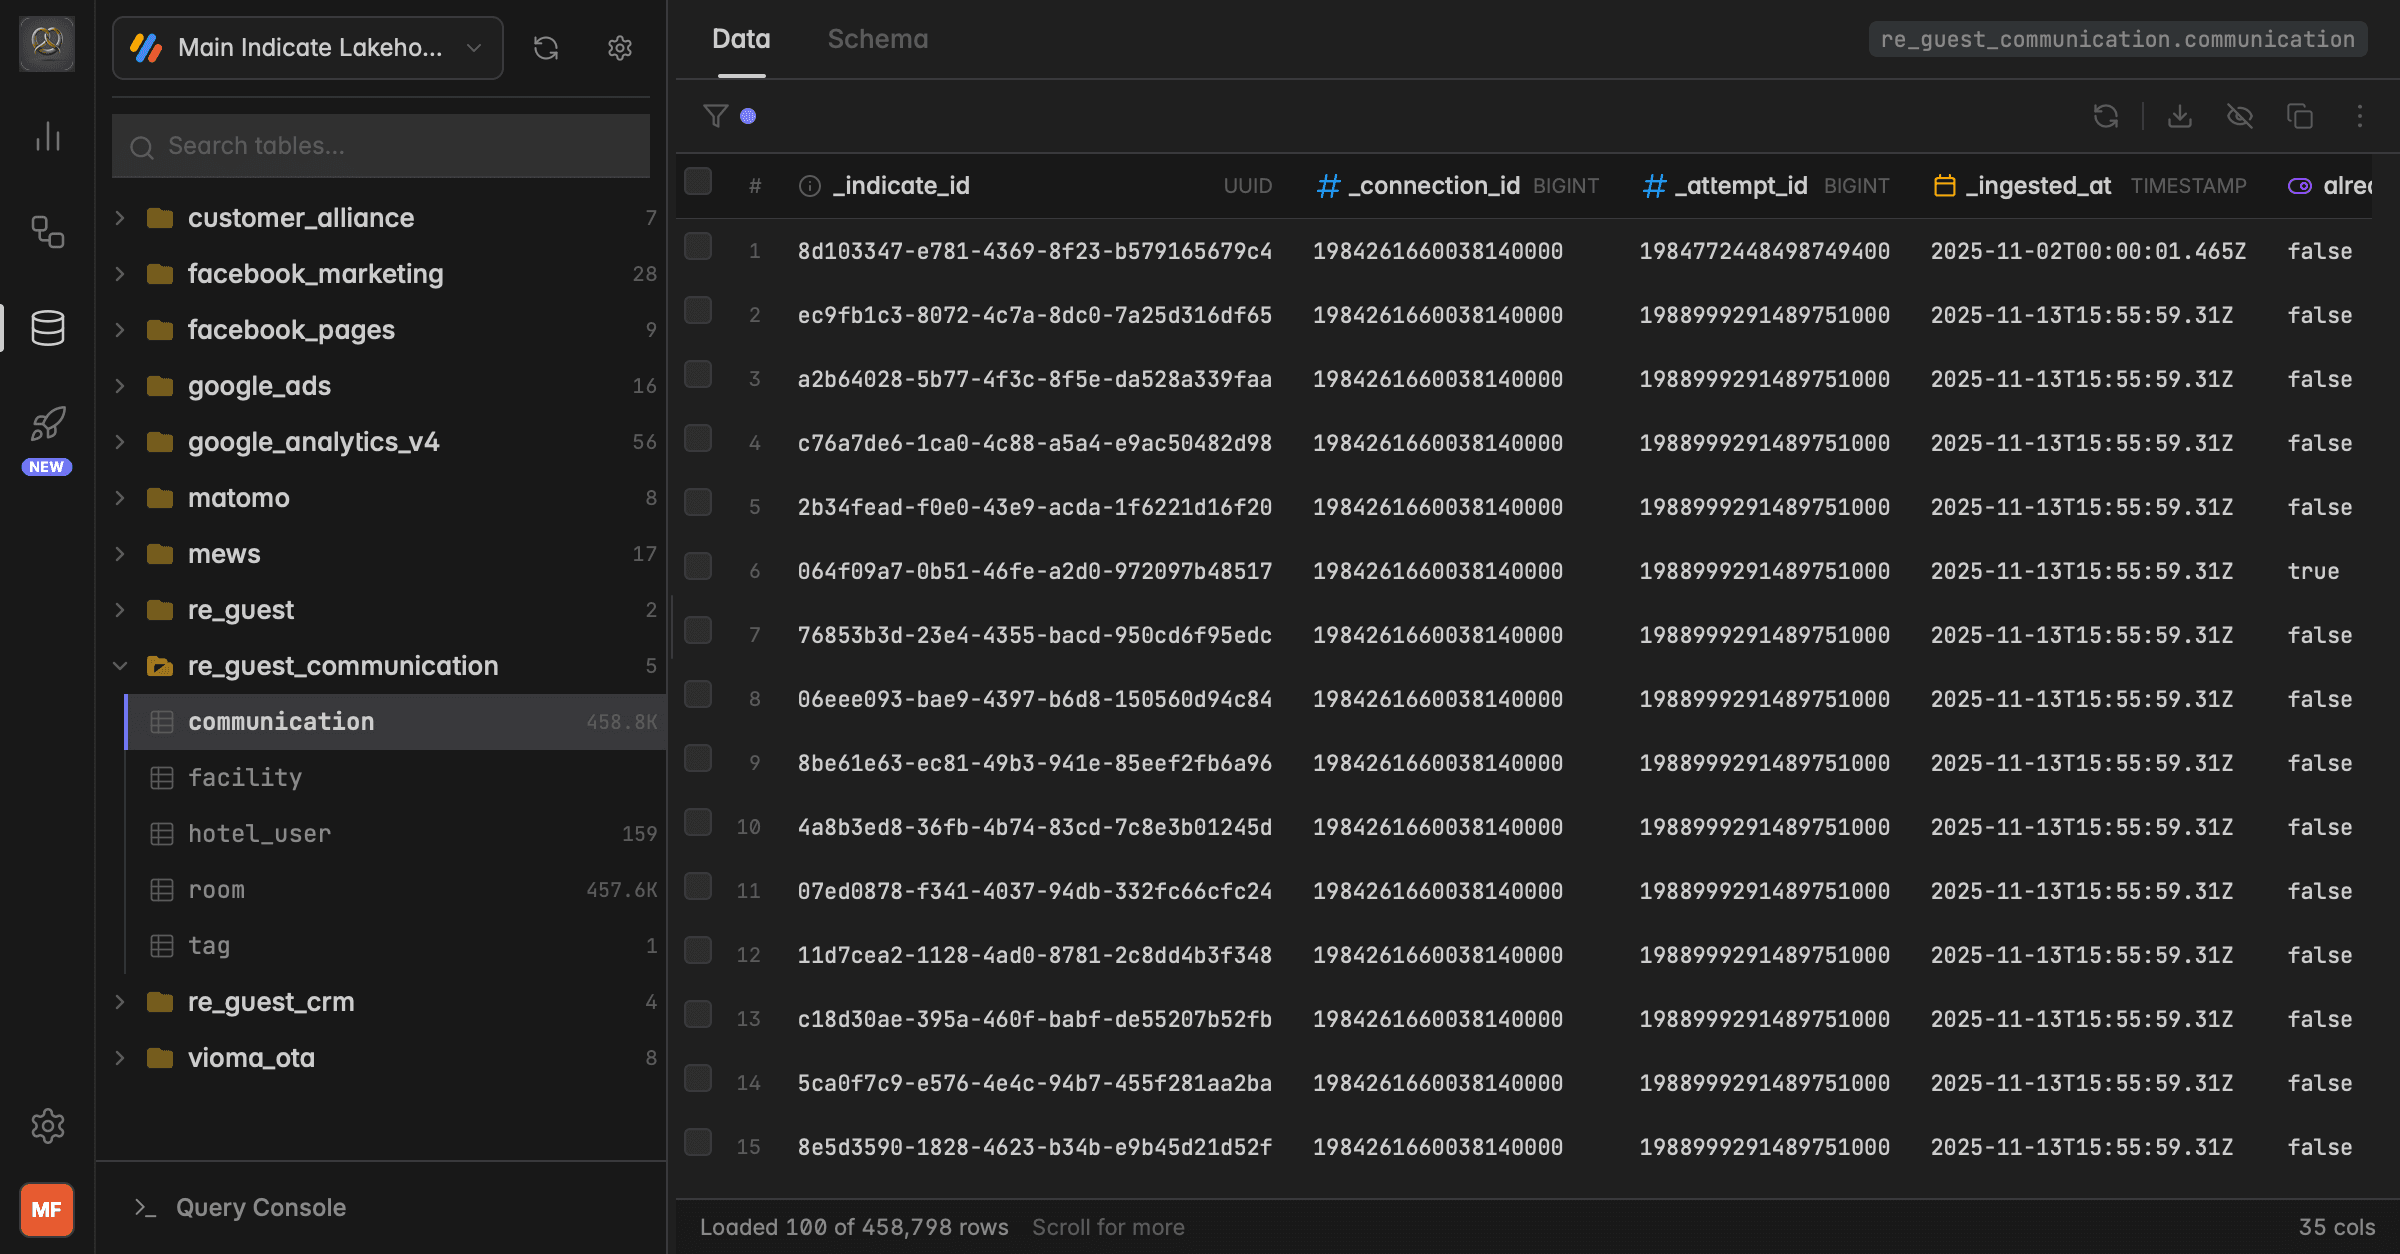
Data Studio, opened with the database-table icon in the left rail, is the direct view into your warehouse: Every table your connections have synced and every table you imported, with its rows and its columns. It is the most honest view of your source data. If a number looks wrong on a dashboard, this is where you see what actually arrived.
Tables are grouped by schema. Every connected source gets its own schema, imported files land in uploads.
The rows are raw, exactly as the source delivered them, including fields no metric uses.
Only data from connections in your own space is here. Insights another space shared with you do not bring their tables along.
Data Studiois for Admins. Other roles do not see it in the rail.
How do I open a table?
Click the database-table icon in the left rail. The Warehouse tree opens on the left with one folder per schema and the number of tables in each.
Click a schema to expand it, then click a table. Use Search tables at the top of the tree to find one by name.
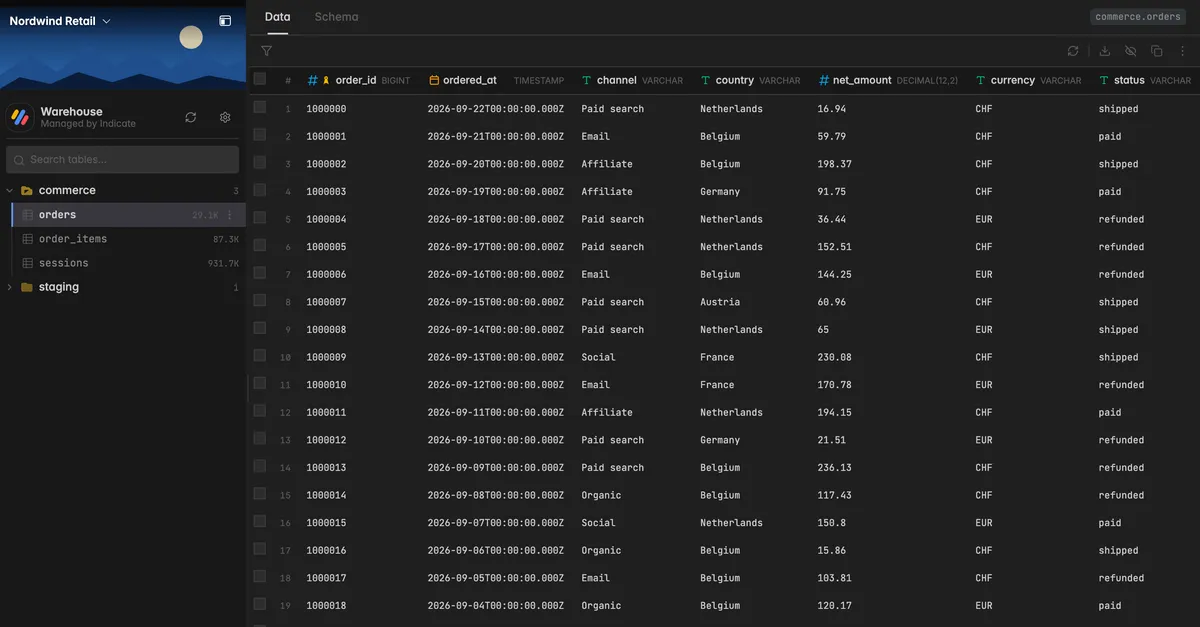
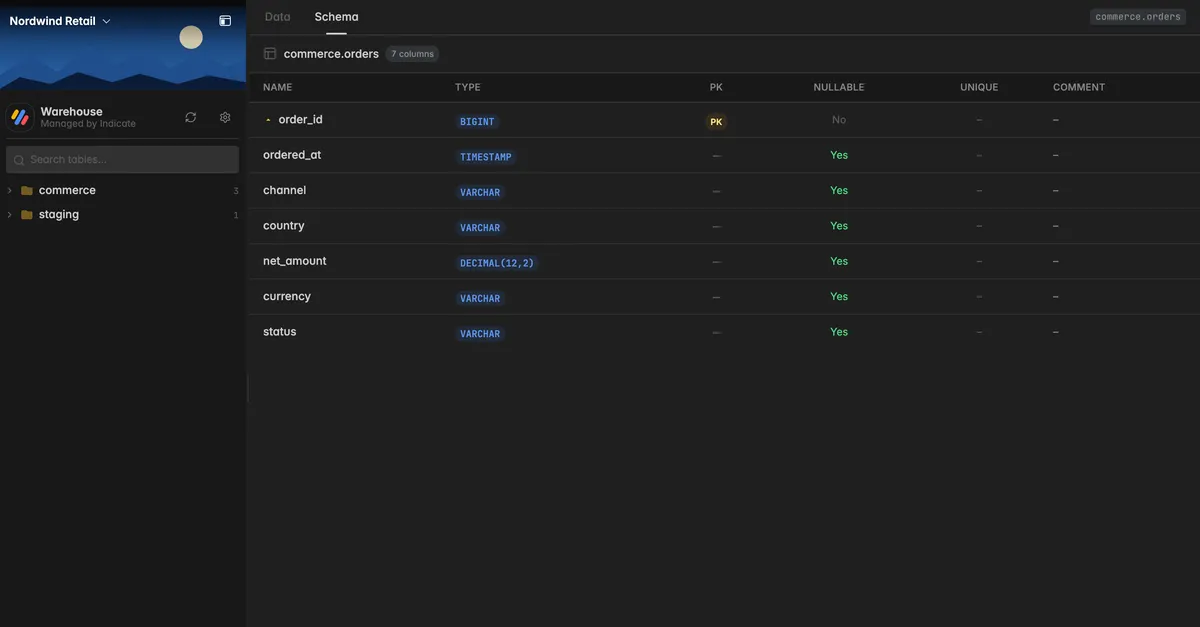
The table opens on the Data view: One row per record, the type of each column in the header, and the row count. Click Schema at the top to switch to the column view with Name, Type, PK, Nullable, Unique, and Comment.
The icons at the top right of the table are Toggle filter, Reload data, Export data, Toggle record view, Copy query, and More actions.
How do I filter rows?
Click Toggle filter. A filter bar opens above the table with a DSL expression, for example { "$eq": [{ "$identifier": "col" }, { "$literal": "value" }] }.
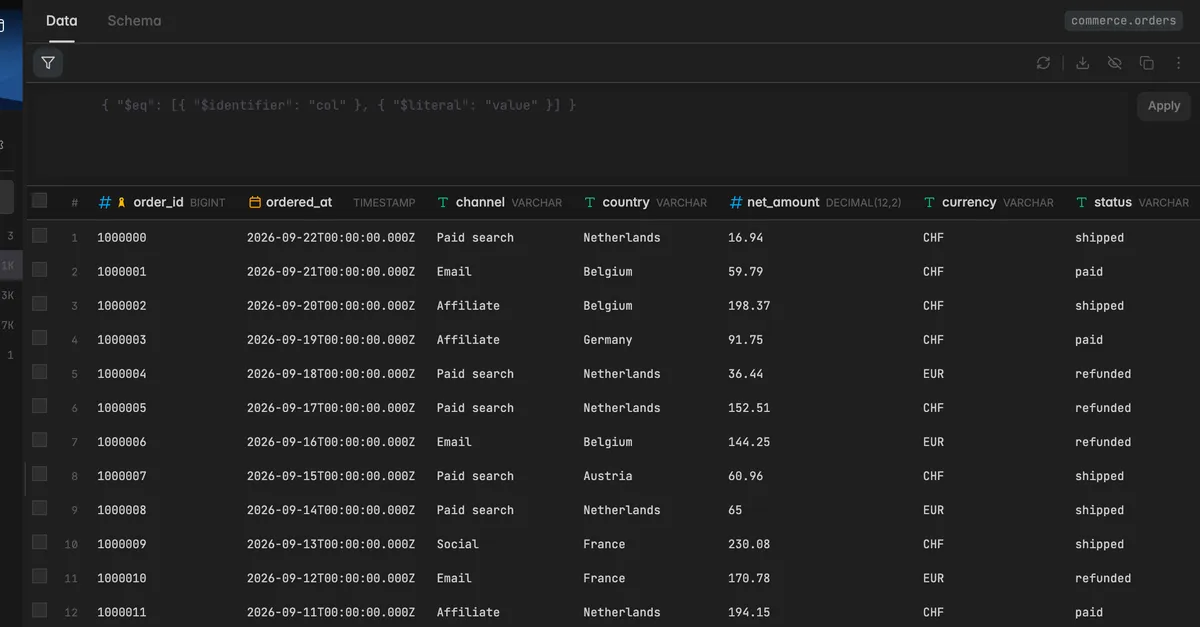
Edit the expression and click Apply.
The fastest way to build a filter is to right-click a cell. The context menu offers Copy value, Copy row as JSON, Filter $and with conditions such as =, ≠, >, ≥, <, ≤, IS NULL, and IS NOT NULL, and Filter $or for alternatives. The condition is written into the filter bar for you.
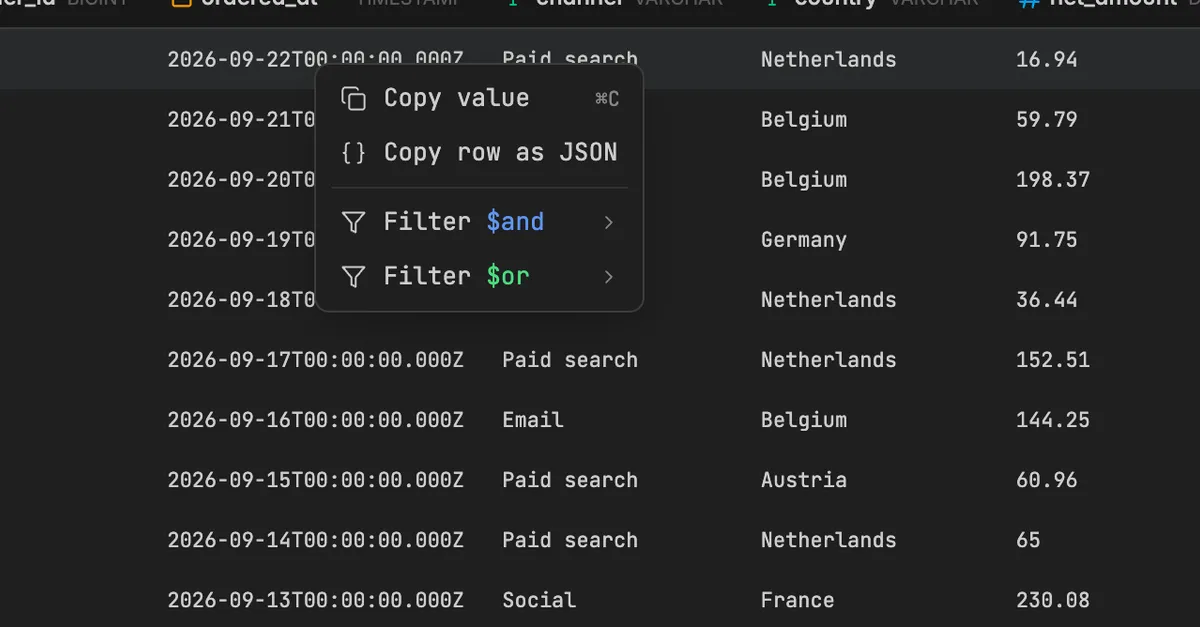
Several connections of the same source, for example two shops, write into the same table. Every row carries the connection it came from in the system column _connection_id. Right-click that value and pick Filter $and to see one connection only. The ID is on the connection's Overview under
Data sources→Connections, see Connections.
How do I export a table?
Click Export data. The dialog Export Data opens.
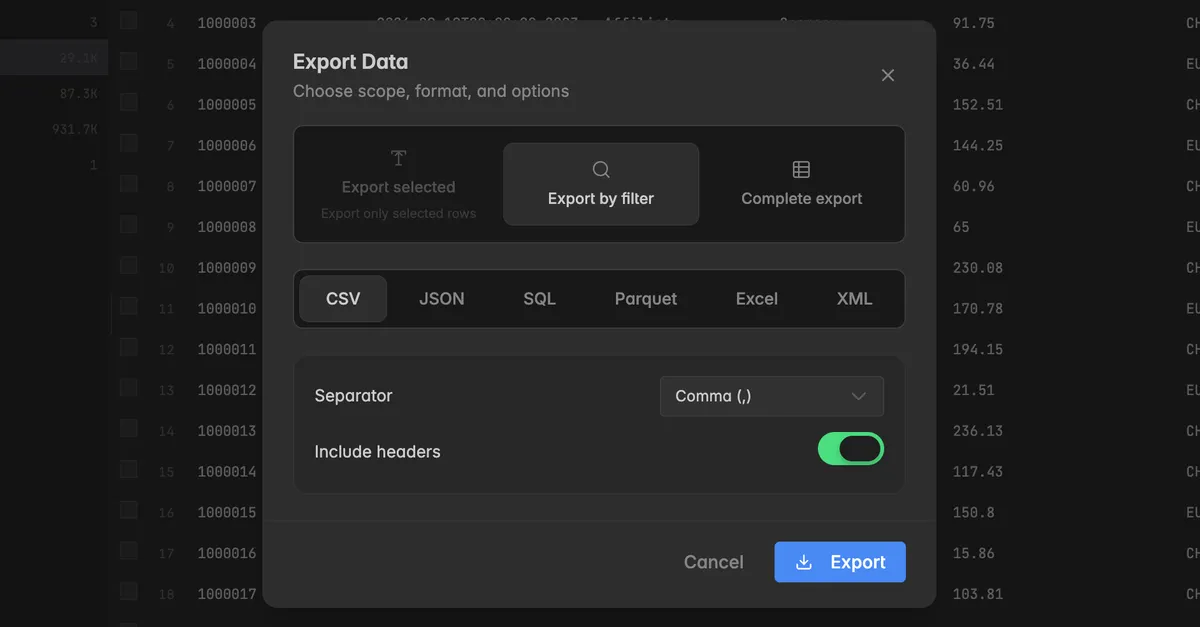
Pick the scope: Export selected for the rows you ticked, Export by filter for the rows matching the current filter, or Complete export for the whole table.
Pick the format: CSV, JSON, SQL, Parquet, Excel, or XML. For CSV, choose the Separator and whether to Include headers.
Click Export.
The same export sits in the table's menu in the tree as Export table.
Show DDL and Copy query
Click More actions at the top right of the table:
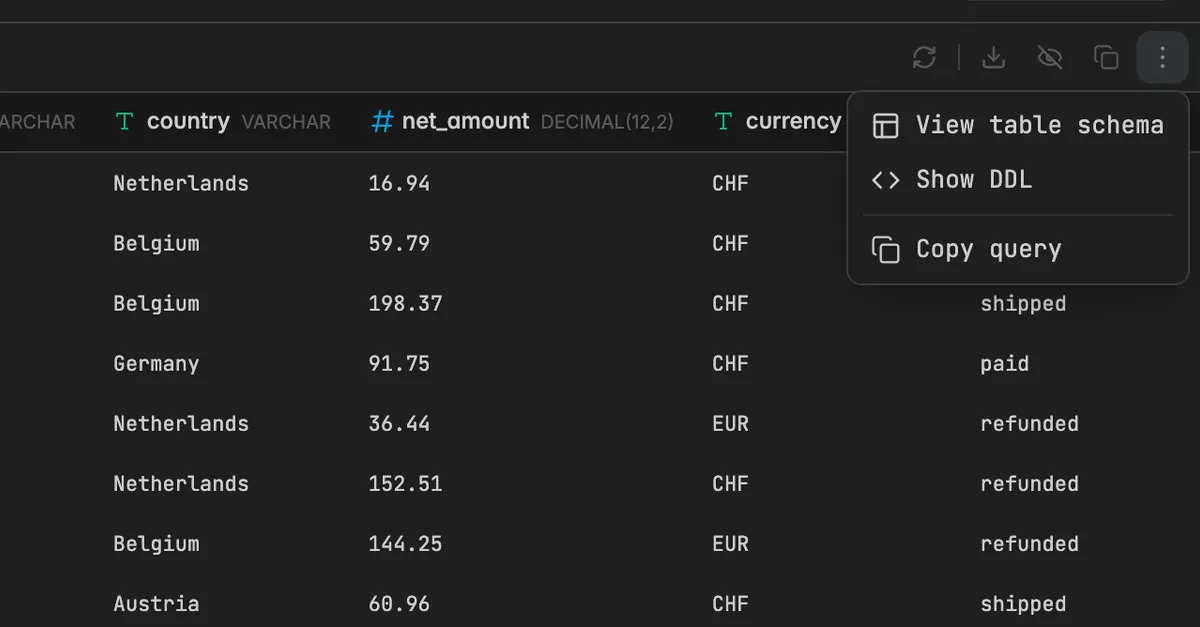
View table schema: Switches to the Schema view.
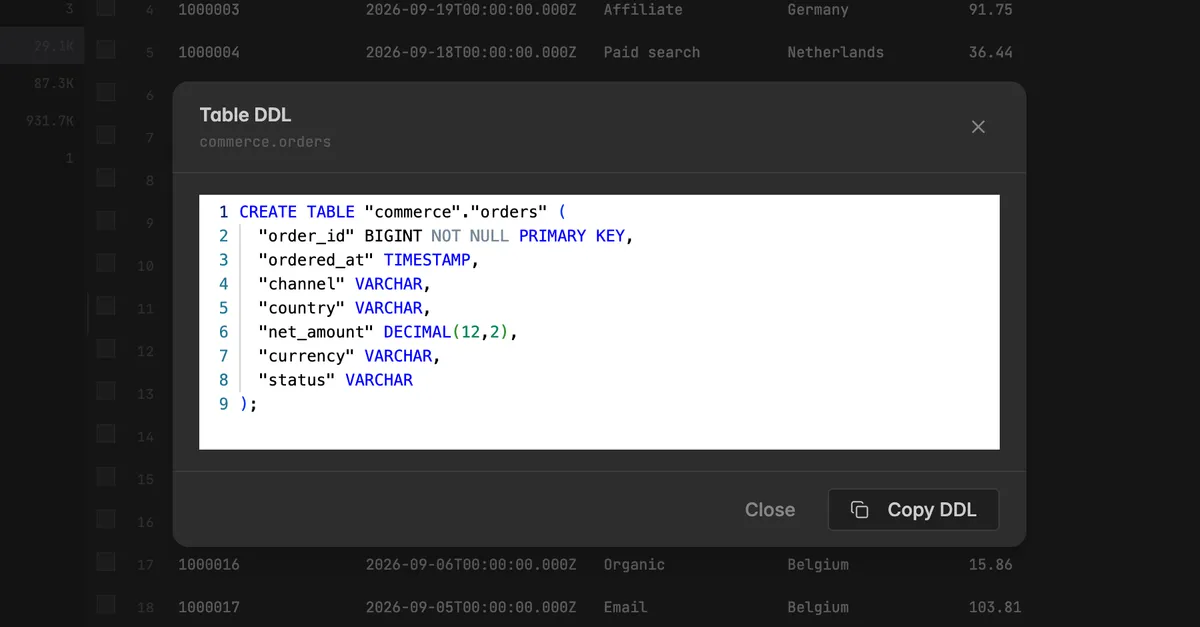
Show DDL: Shows the CREATE TABLE statement of the table with Copy DDL. Hand it to an AI assistant when you build metrics, see Build a custom KPI in KPI Studio.
Copy query: Opens Current query, the query behind the view including your filter, as a DSL JSON object, with Copy DSL. Paste it into an assistant or into a support request.
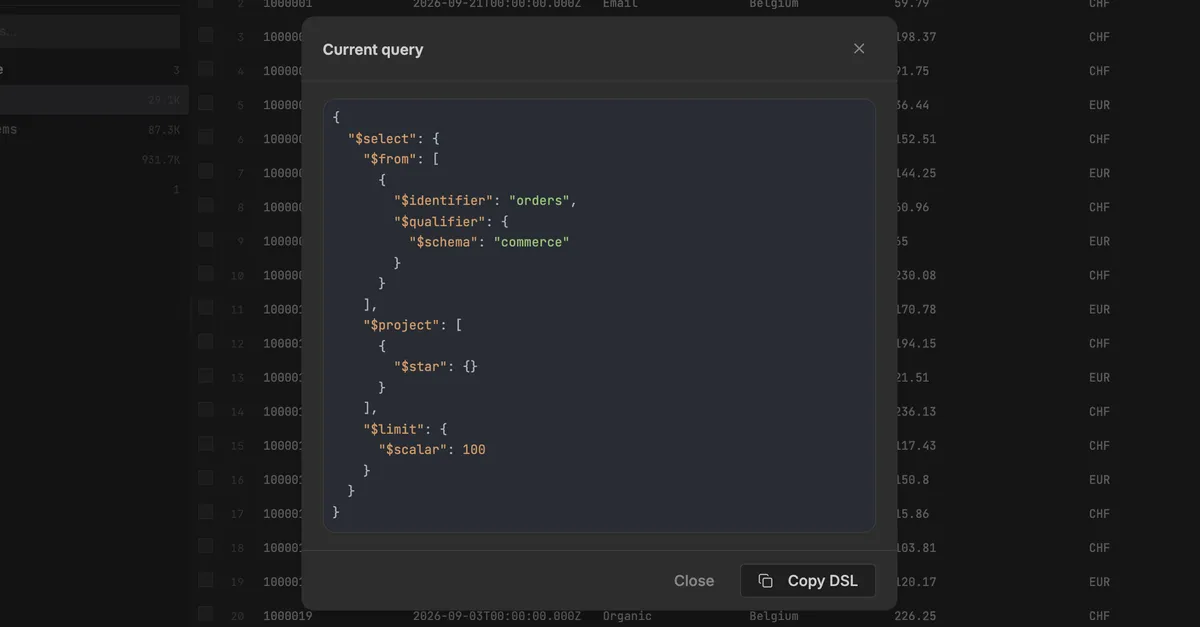
Reload data refreshes the view. It does not start a sync. New data arrives with the next run of the connection, see Sync and activity.
What else is in the tree?
Hover over a table or a schema and click the
⋮icon for View schema, Copy name, Export table, Truncate table, and Drop table. Truncate and drop are permanent.The download icon next to the search box opens Export the schema DDL: The schema of the whole catalog, one schema, or one table as a JSON file.
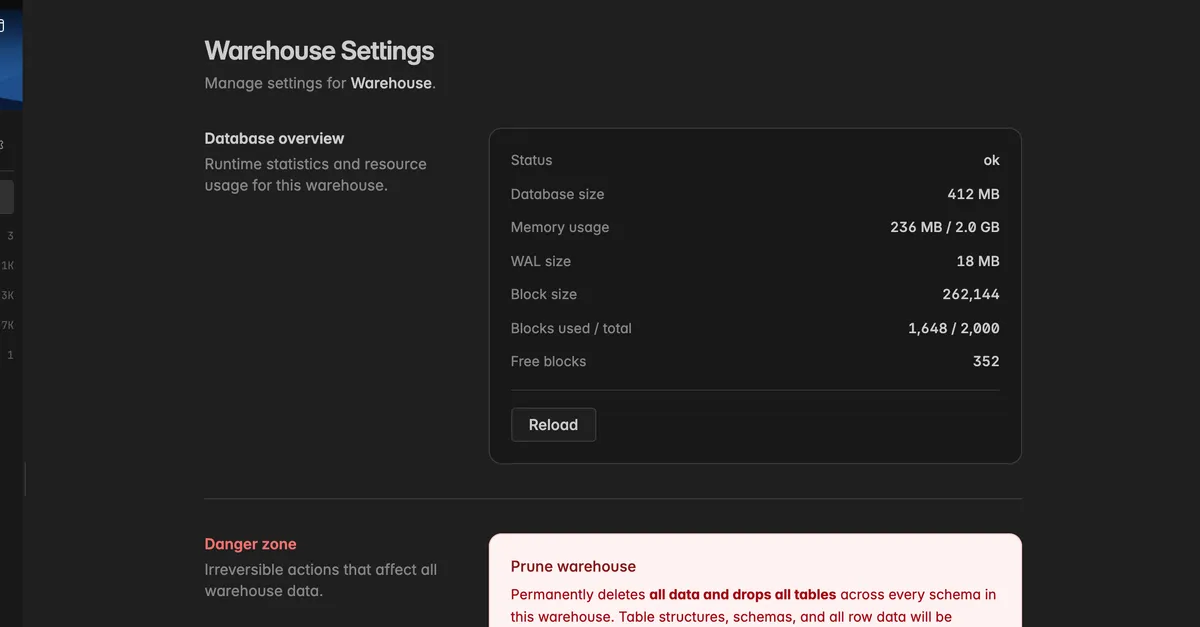
The gear icon opens Warehouse Settings with the Database overview, status, size, memory, and blocks, and the Danger zone with Prune warehouse, which drops every table in every schema. Admins only.
Troubleshooting
I do not see Data Studio
Data Studioneeds the Admin role. Ask a space admin.
The tree is empty
No connection has synced yet and nothing was imported. Connect a source, see Add a data source, or import a file, see Import.
Insights another space shared with you do not bring tables. Only your own connections do.
A column is empty
Personal fields are only synced when the connection was made with PII on. Check the connection's Settings.
The field is not maintained in the source system. The table shows what the source delivers, nothing more.
Two shops or two properties are mixed in one table
That is by design. Filter on _connection_id to separate them, or group a widget by the connection.
The numbers here differ from the dashboard
A metric applies a definition to these rows: A filter, a sum, a date perspective. See Metrics for where the difference usually comes from.