
Metrics
What a metric, a KPI collection, and a dimension are, where to see which metrics you have, managed versus custom, and where the numbers come from.
What is a metric?
A metric is one named number, for example Revenue, Orders, Sessions, or Conversion rate. In Indicate every metric is a definition: which fields to read, how to filter them, and how to add them up, sum, count, or avg. Metrics are what you pick when you build a widget, ask Resi, or connect an AI assistant. Nobody queries the raw tables, everybody queries the metric, and the metric returns the same answer every time.
Three words come with it:
KPI collection: a set of metrics and dimensions that belong together, for example everything a shop delivers. Managed collections come with an integration, custom ones your team builds in KPI Studio.
Insight: a KPI collection connected to a source. This is what widgets read. See Insights.
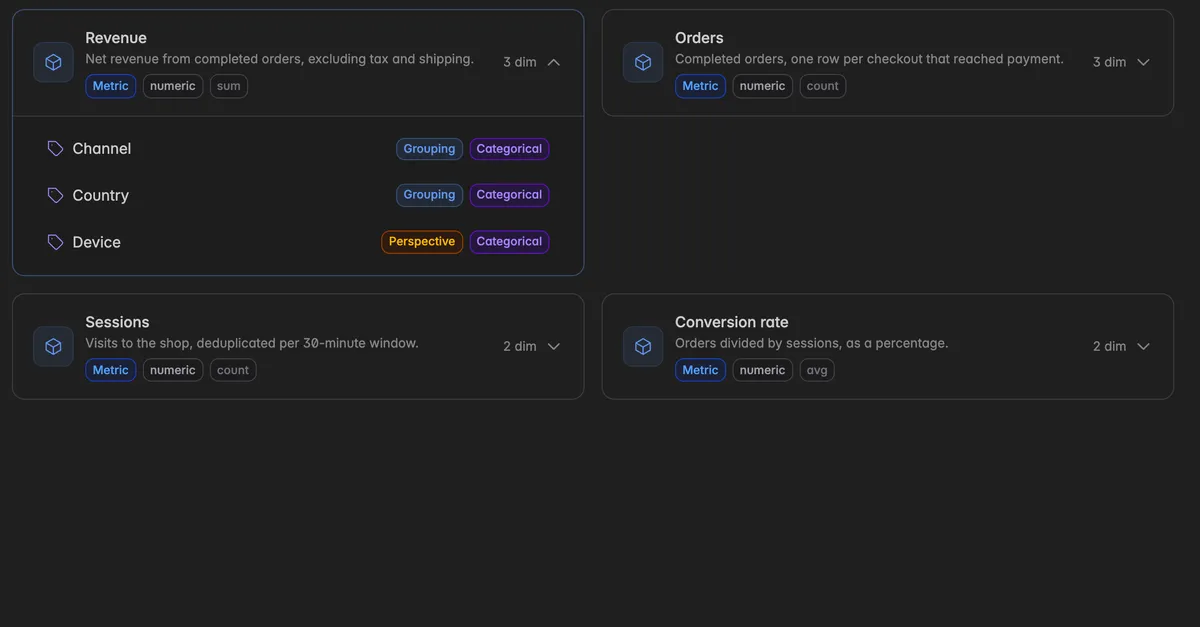
Dimension: what a metric can be split by. A Grouping dimension such as
ChannelorCountrygives one value per channel or country. A Perspective dimension is a date, for example the arrival date or the booking date, and decides which period a record counts in. See Grouping and perspective.
Note: The numbers in Indicate mirror your source system. Indicate reads what the PMS, the ad platform, or the shop delivers through its interface, applies the metric definition, and returns the result. If a value looks wrong, the cause is almost always in the source or in how a field is defined there.
Where do I see which metrics I have?
There are three places, depending on what you want to know.
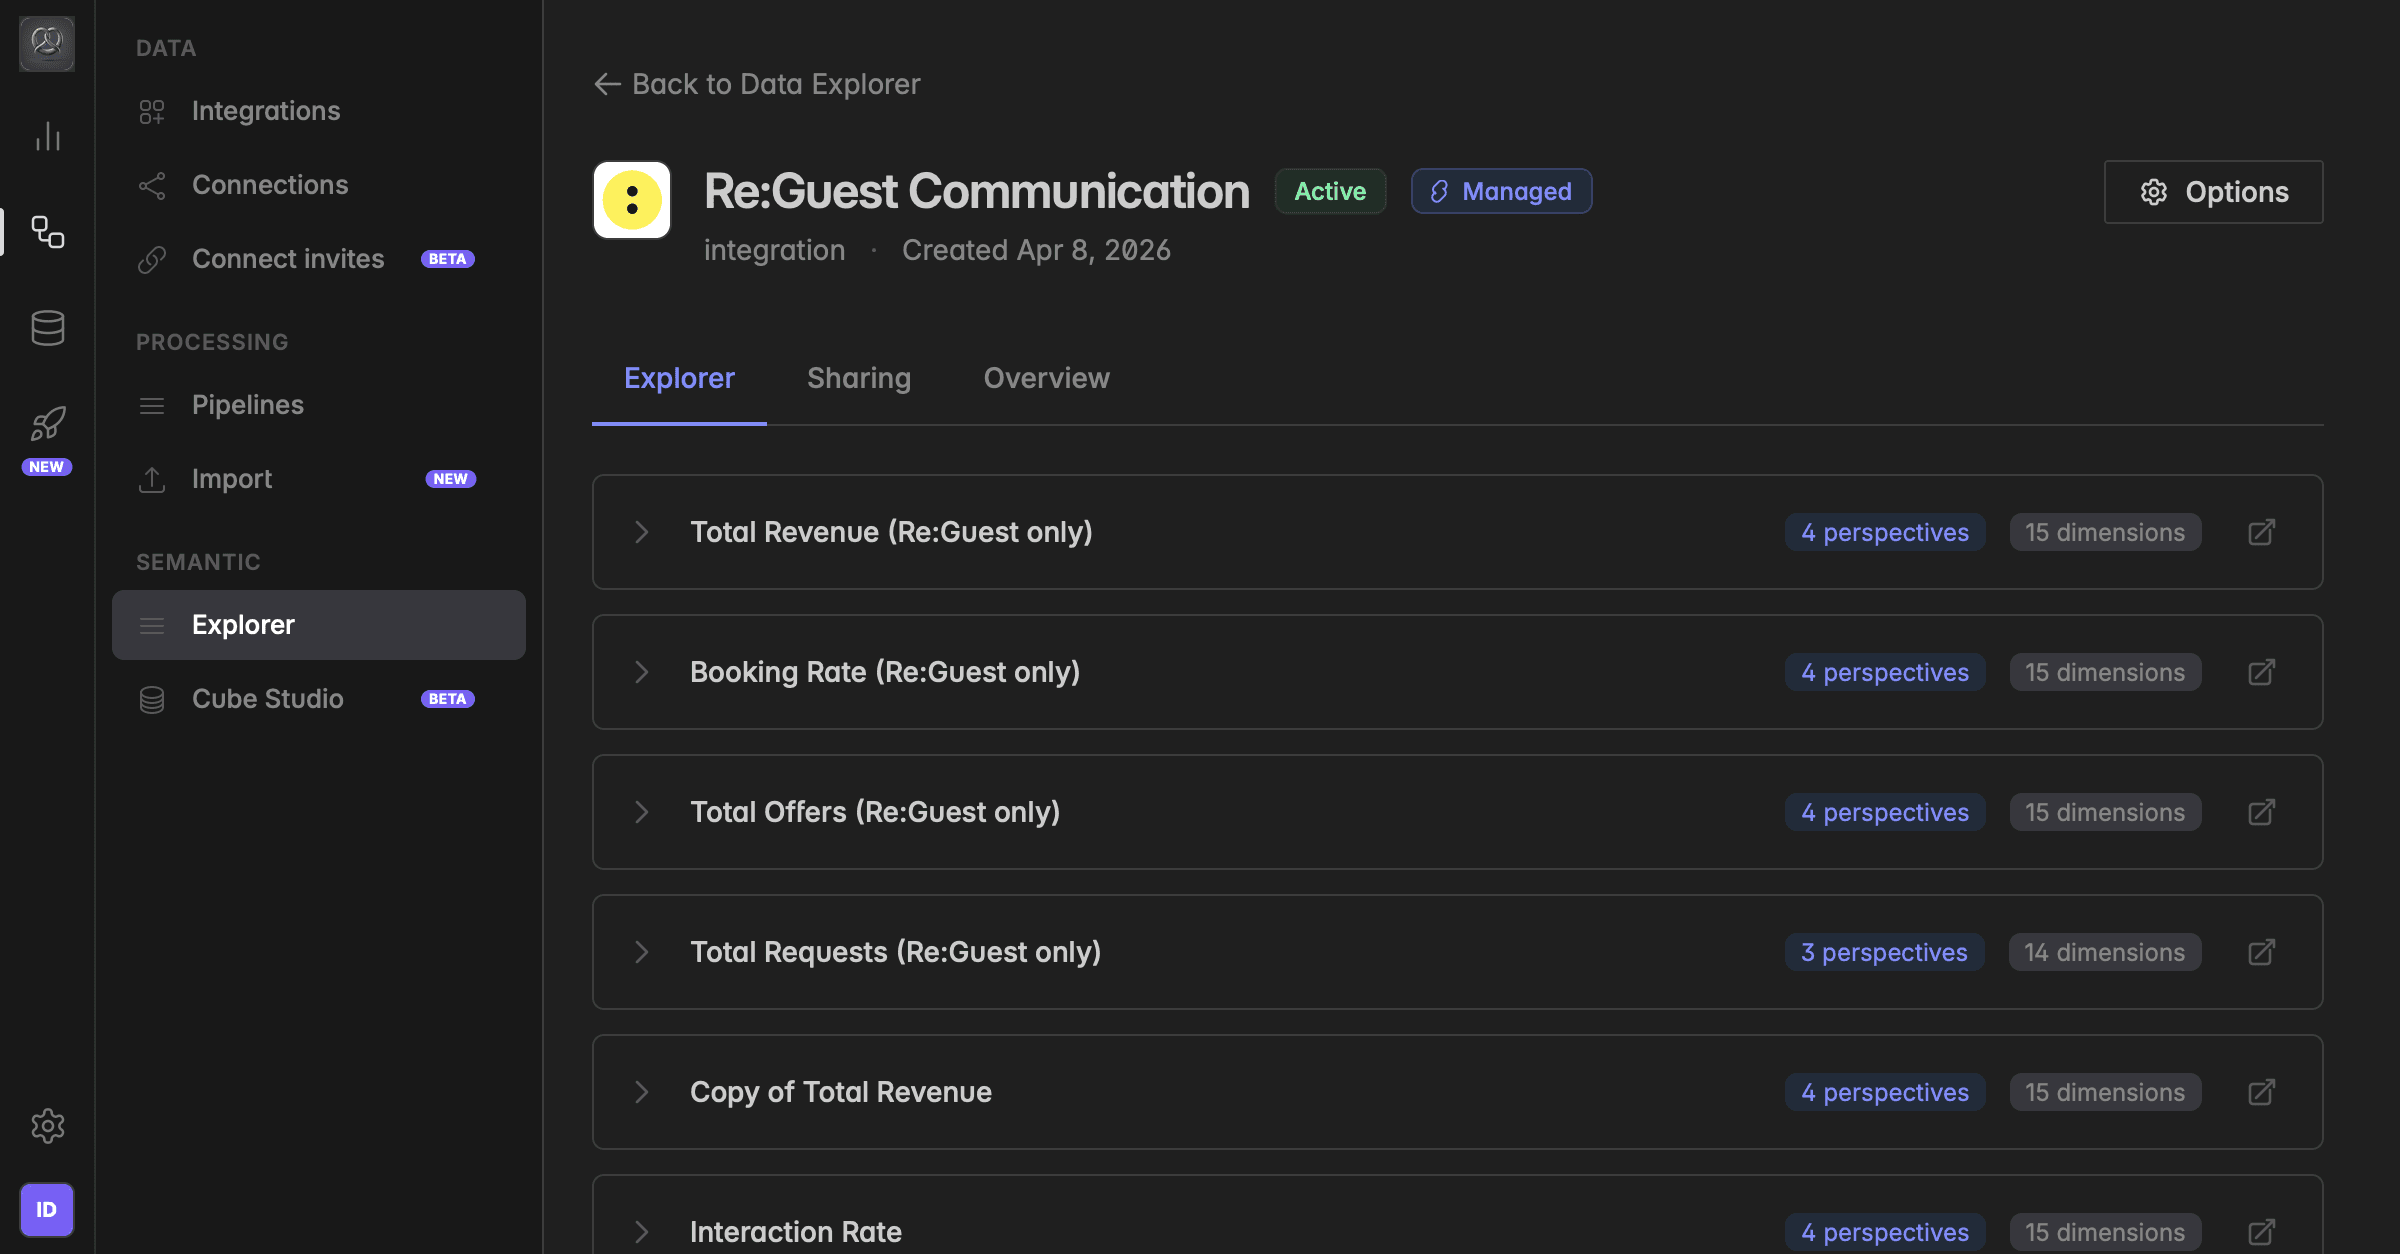
Before you connect: the Catalog of an integration
Open Data sources → Marketplace, click Connect on an integration, and open the Catalog tab. It lists every KPI the integration delivers, with its description, kind, type, aggregation, and dimensions. Click a KPI to see its dimensions with their scope, Grouping or Perspective.
With numbers: the Insights tab of an Insight
Open Data sources → Insights, click an Insight, and pick a metric on the left. The panel shows the figures for the period, Sum, Mean, Median, Min, Max, Count, First, and Last, and a chart. Change the time range, the grain, the grouping, the perspective, and add filters to see how the metric behaves. Nothing is saved, it is a scratchpad. See Insights.
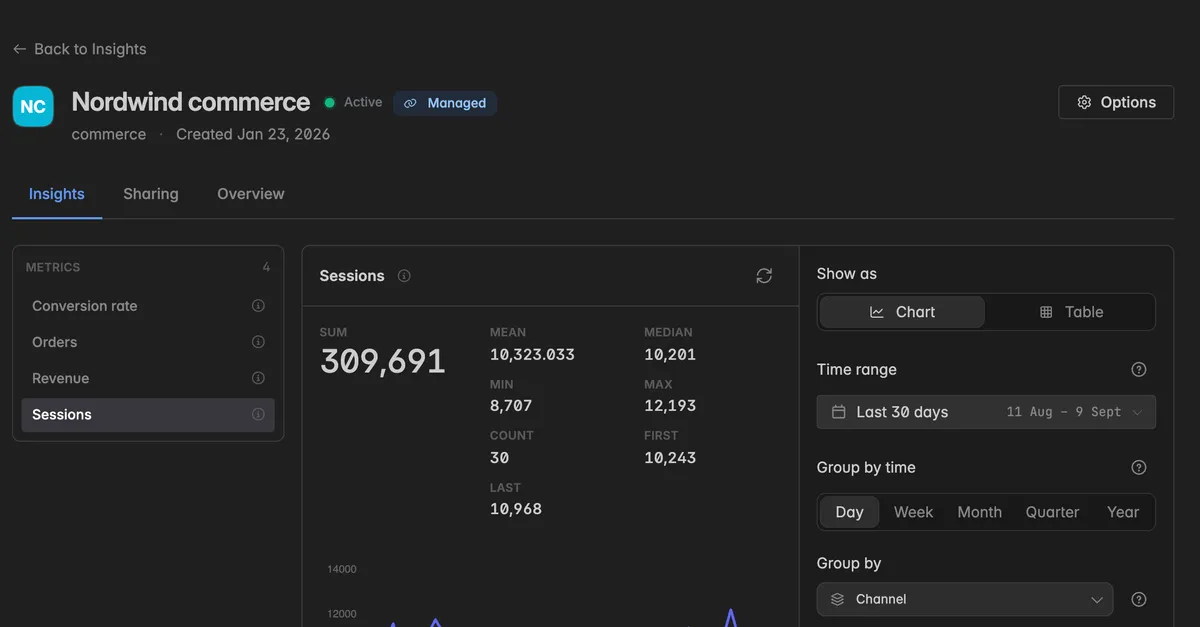
Hover over the i icon next to a metric to read its description. If a metric shows no data for the last 30 days, widen the time range. Some metrics, for example forecasts or occupancy, only hold values in the future and need a Next … preset.
The definitions: KPI Studio
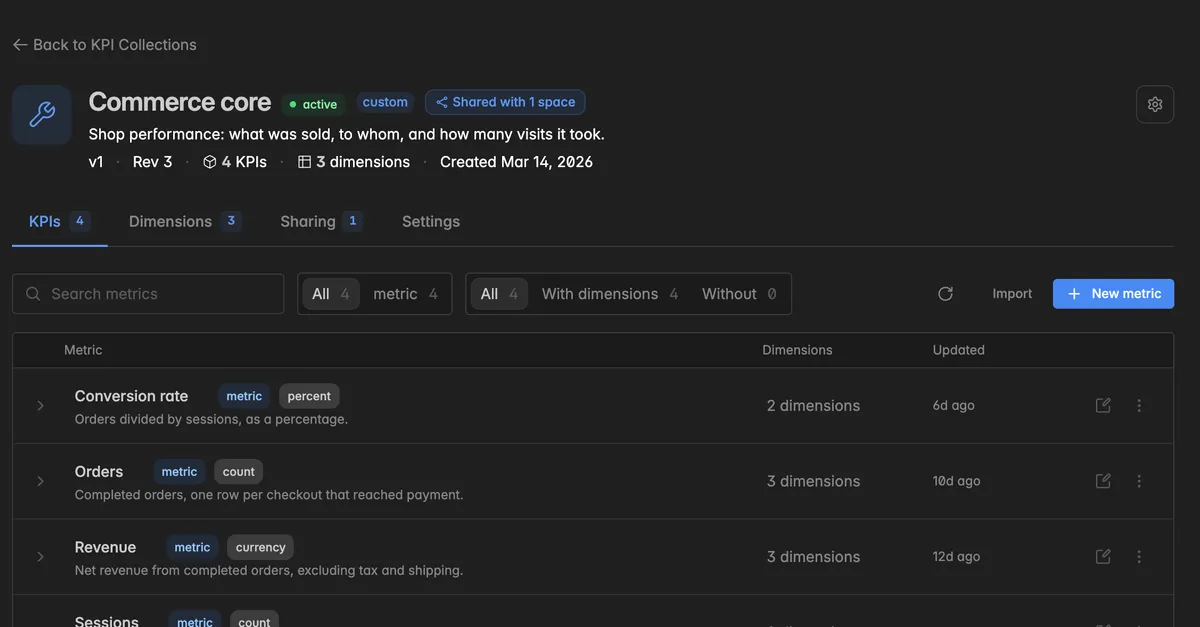
Open Data sources → KPI Studio. The page KPI Collections lists every collection in your space with its status, Active, Deprecated, or Draft, whether it is Managed or custom, and how many KPIs and dimensions it holds.
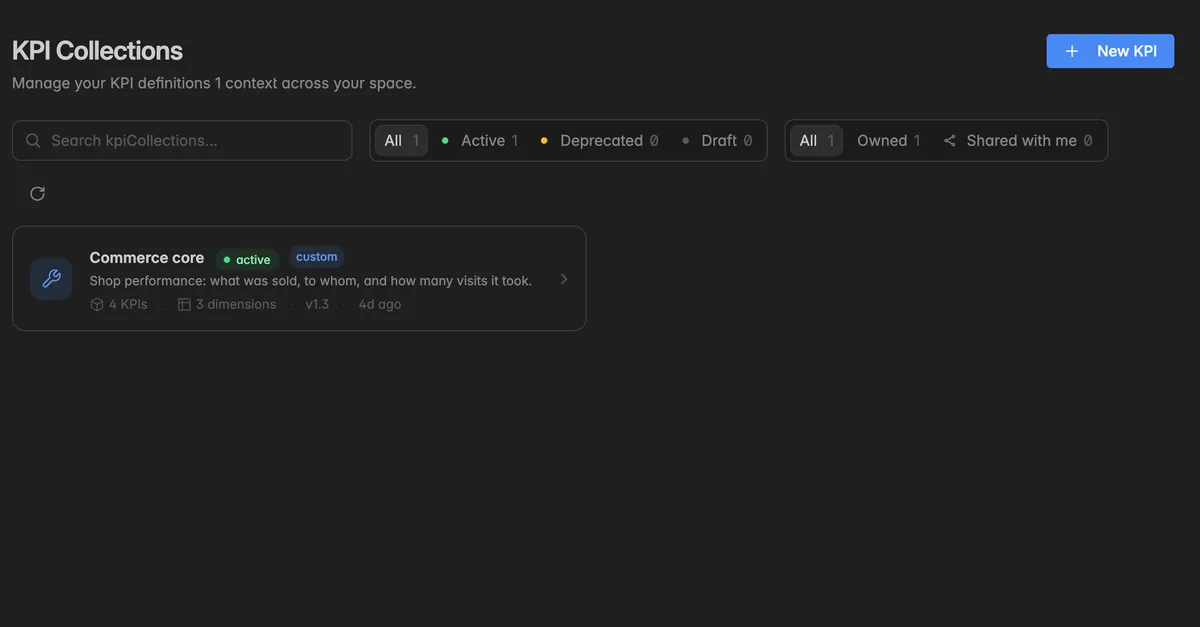
Click a collection to open it:
KPIs: every metric with its unit, description, and how many dimensions it has. Edit in studio opens the definition.
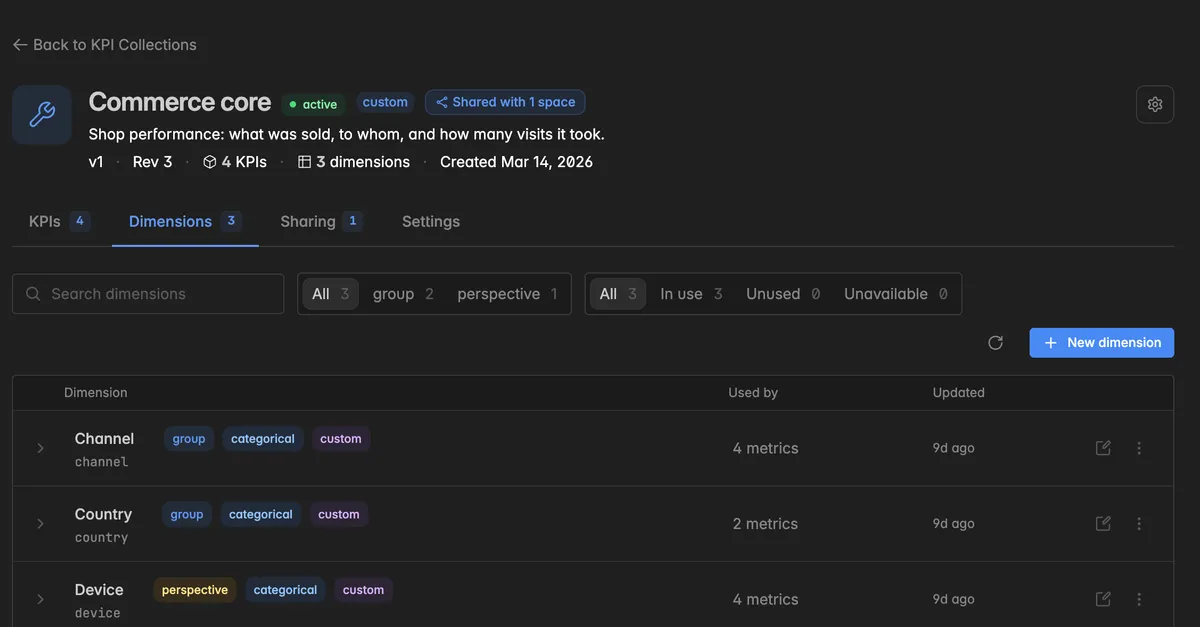
Dimensions: every dimension with its scope, group or perspective, its type, and which metrics use it.
Sharing and Settings: who else can use the collection, and its name, description, and version.
Managed or custom?
Managed metrics come with an integration. Indicate defines and maintains them, and they cover the standard figures of that system: revenue, occupancy, sessions, conversions. You cannot edit them, but you can read every definition.
Custom metrics are defined by your team, your agency, or the community in KPI Studio, for figures your business needs that a managed collection does not carry, or for calculations on top of imported data. Publish the collection as an Insight to use its metrics in widgets. See Build a custom KPI in KPI Studio and Publish a KPI collection as an Insight.
Where do the numbers come from?
Every metric reads from the tables a connection has synced, or from a table you imported. The connection writes what the source delivers, the metric definition turns it into one number. Two consequences:
What arrives is what you see. A record that exists twice in the source appears twice here. A field that is empty in the source is empty here.
An interface can deliver data differently from what the source shows on screen. A common example: the PMS interface delivers revenue without VAT, while the PMS screen shows it with VAT. Both are right, they describe different things. Another one is timing: a PMS may spread a five-night stay over five days on screen, but deliver the whole amount on the check-out day.
If you are unsure how a field is delivered, ask support.
Troubleshooting
My numbers are wrong
Most of the time the source is set up in a way that produces the numbers. Typical hotel examples: a room category created twice, a virtual category such as Double room for families next to Double room for the same physical room, or a reservation entered under two profiles. Indicate receives all of them as separate records and cannot tell them apart. Clean up the categories in the PMS, the metric follows.
If the source is clean, the definition may be wrong, for example an average where a sum is needed. For a custom metric, open it in KPI Studio, run a dry run, and fix the definition. For a managed metric, contact support.
The numbers differ from my source system
- Check what the field contains. Revenue with or without VAT, and revenue per night versus revenue on the billing day, are the usual reasons. Open the Catalog of the integration to read the description of the metric.
Many values are empty or misspelled
- A free-text field in the source stays free text here, with every typo. A field that is not mandatory in the source is often empty. Fix the discipline at the source, the metric cannot.
A metric has no data at all
The module behind it is not in use in the source system, so the source produces no data for it. Check in the source whether the feature is active and licensed.
Personal data was switched off when the connection was made, so metrics that need person-related fields stay empty. Open the connection under
Data sources→Connections, check its Settings, and reconnect with PII on if you need those fields.The time range is off. Widen it to All time, or use a Next … preset for metrics that only hold future values.
I want a metric the integration does not have
- Build it in KPI Studio on top of the synced tables and publish the collection as an Insight. See Build a custom KPI in KPI Studio.
Was this helpful?