
Sync and activity
How a connection syncs, what the Overview and Activity tabs show, and how to fix a failing sync.
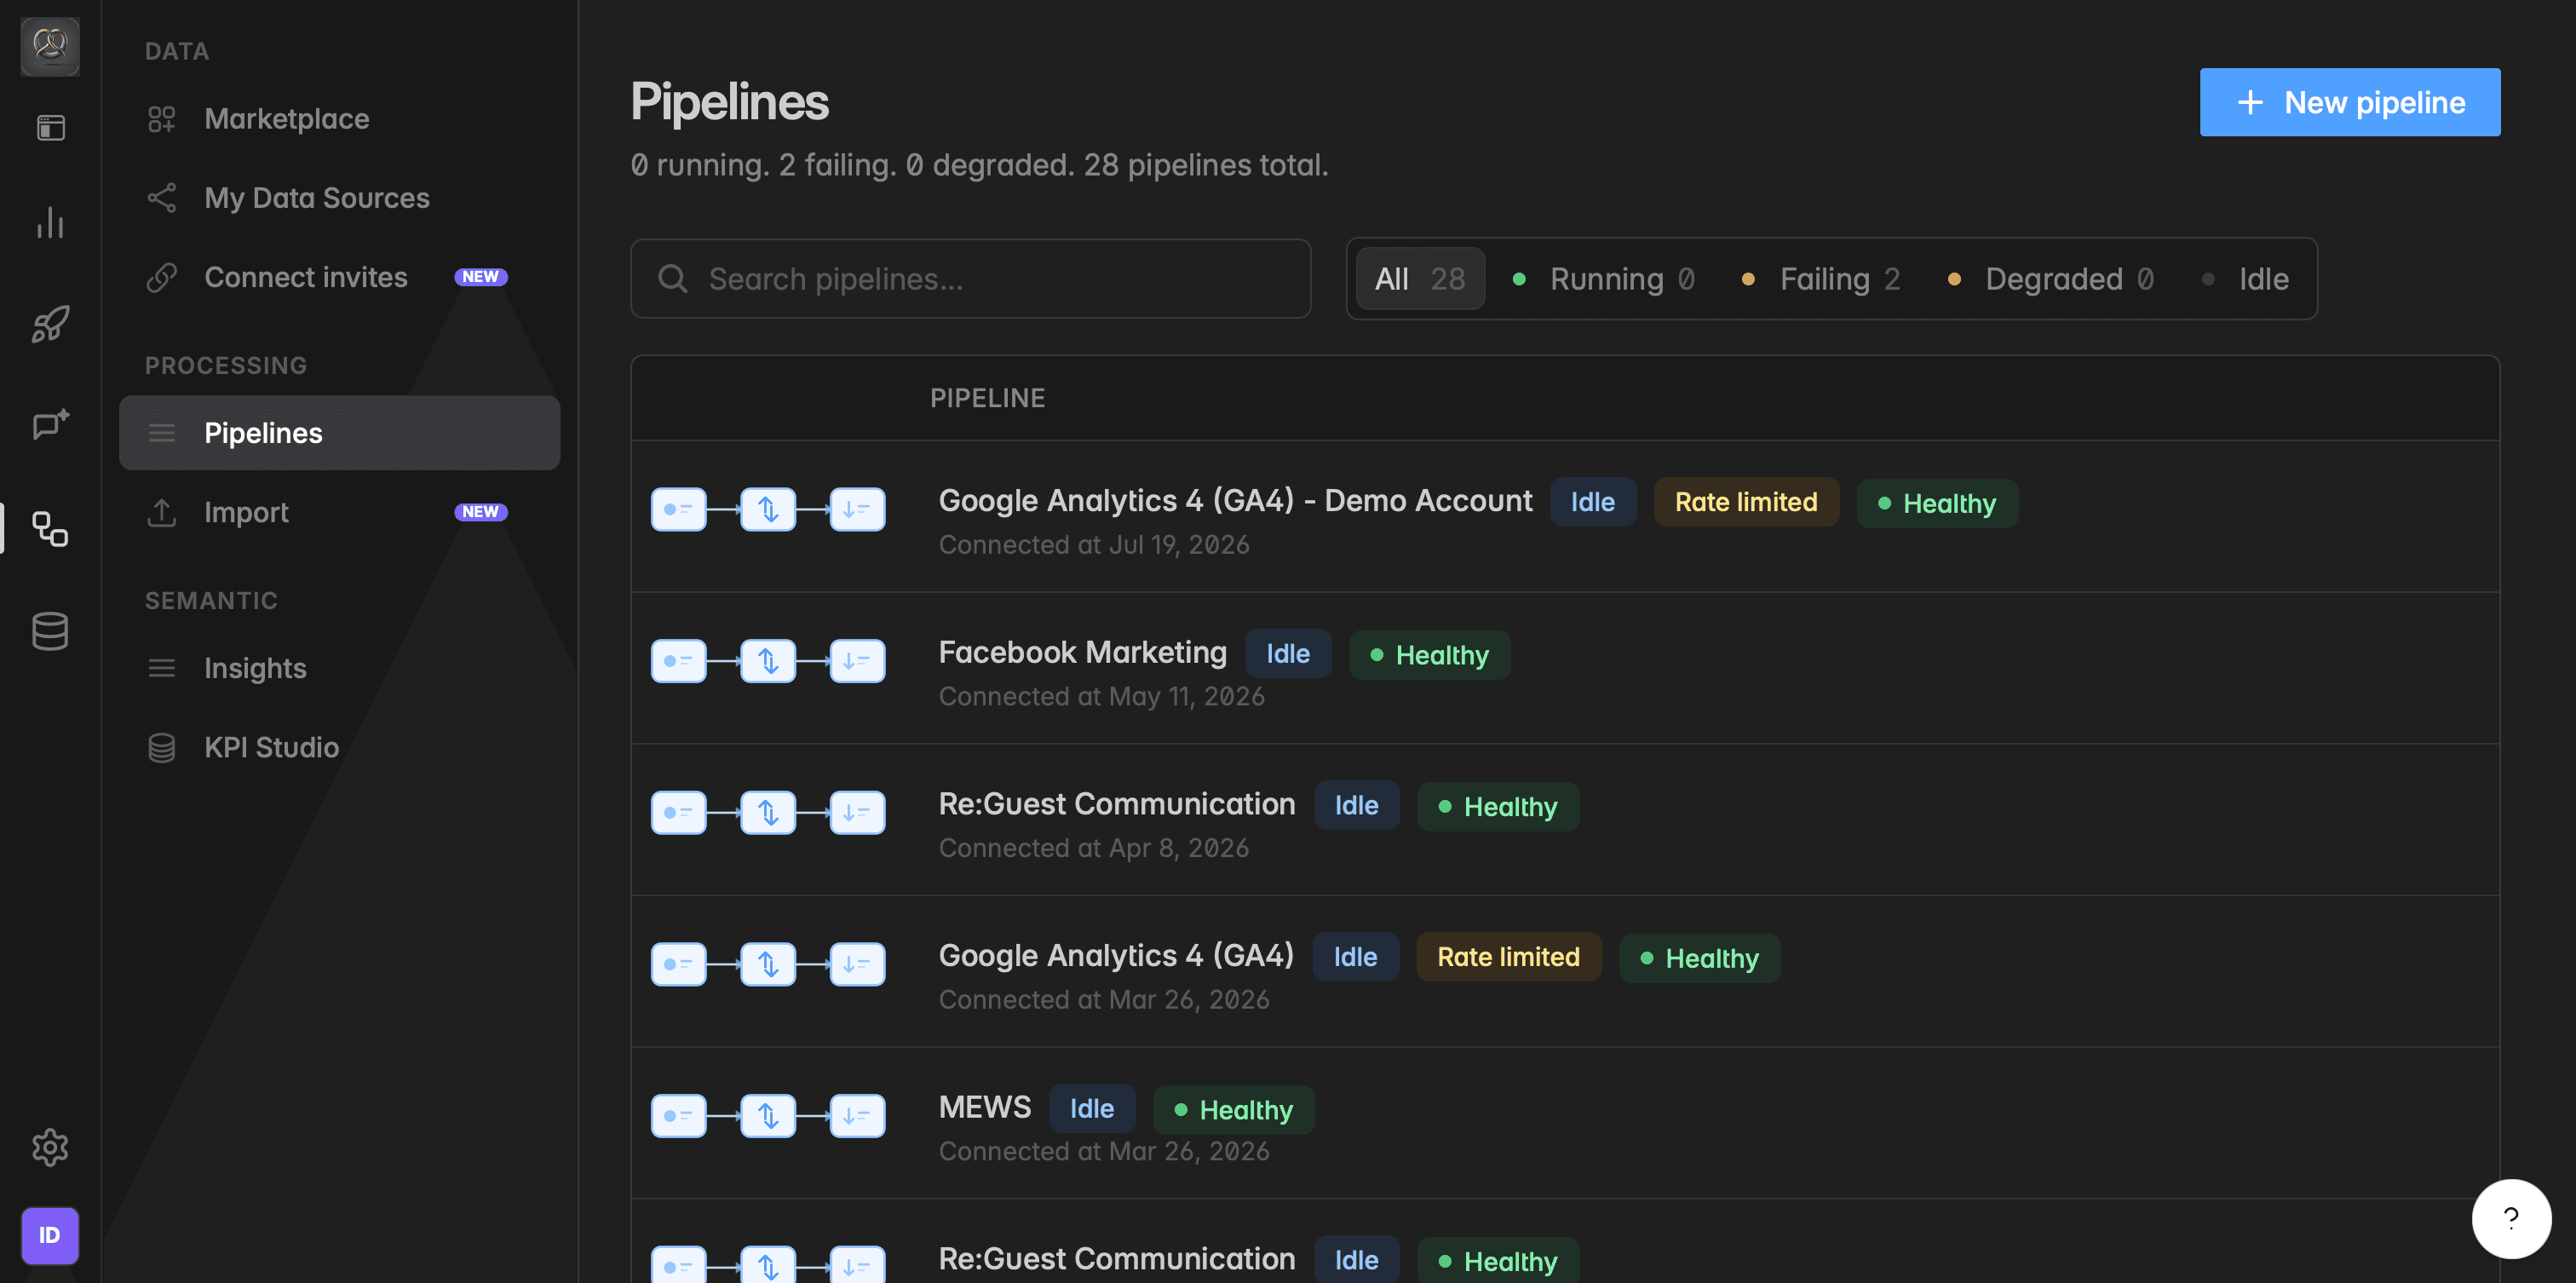
What is the sync?
Every connection has a sync: the job that fetches new data from the source on a schedule, writes it into the tables of your warehouse, and keeps the Insight built on the connection up to date. You do not set it up separately, it is created together with the connection and lives on the connection's pages.
This article covers everything about the sync: starting, pausing, and running it by hand, the schedule, the synced tables, reloading a table, and reading the activity log when something went wrong.
Note: Earlier versions of Indicate called this a pipeline and listed pipelines on their own page. Everything from that page now sits on the connection under
Data sources→Connections.
Where do I see the sync?
Click the database icon in the left rail to open Data sources, click Connections, and open a connection. The Overview tab shows the sync in the middle of the diagram, between the Source and the Destination, with its health badge above it and the controls below.
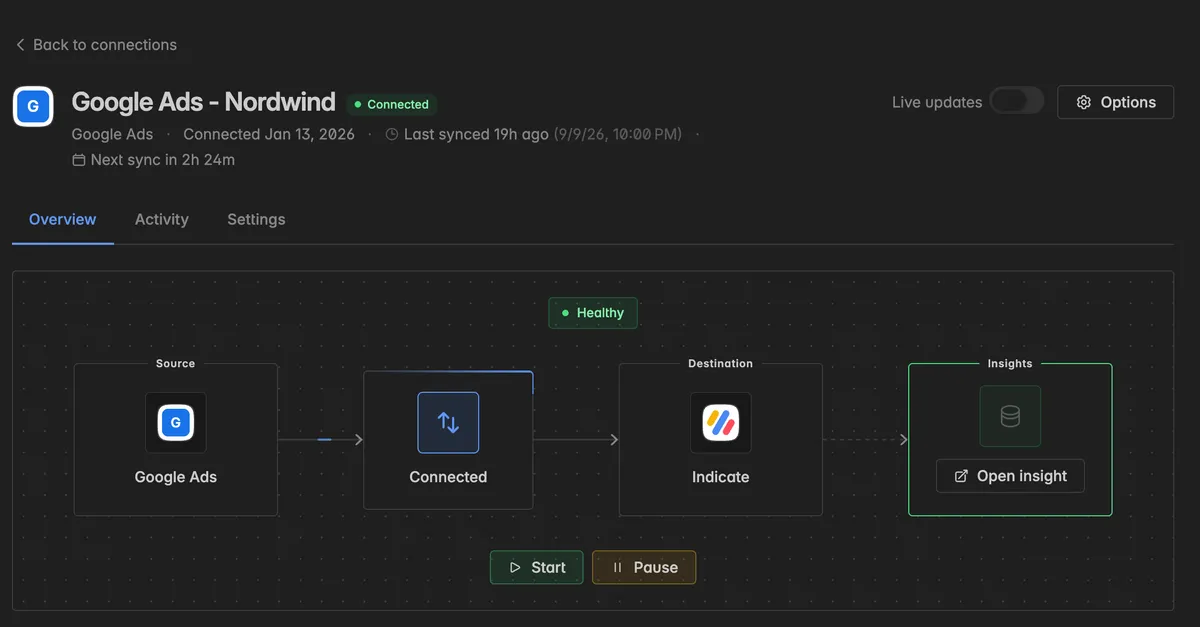
The four figures under the diagram sum up the last 7 or 30 days: Runs, Success rate, Records brought in, and Volume transferred. Switch between 7d and 30d at the top right of the figures.
How do I start, pause, or resume the sync?
The buttons sit under the diagram on the Overview tab. The same actions are in the Options menu at the top right.
Start: sets up and starts the sync on a connection that is not syncing yet. The Overview then reads This connection isn't bringing in data yet with the button Start syncing.
Pause: switches scheduled runs off. The data already synced stays, the Insight keeps working with it, nothing new comes in. The badge changes to Paused.
Resume: switches scheduled runs back on. The next run happens at the next slot of the schedule.
Nothing is deleted by pausing. The tables and the Insight stay as they are.
How do I run the sync now?
Open the connection and click Options at the top right.
Select Sync now.
The run starts immediately instead of waiting for the next scheduled slot. Turn on Live updates in the header to watch it, the badge reads Syncing while it runs and the Activity tab fills up row by row.
Note: Manual syncs are part of the Pro plan. On other plans the entry shows a Pro badge and the connection runs on its schedule only.
What does the schedule say?
The Schedule card on the Overview shows when the sync runs.
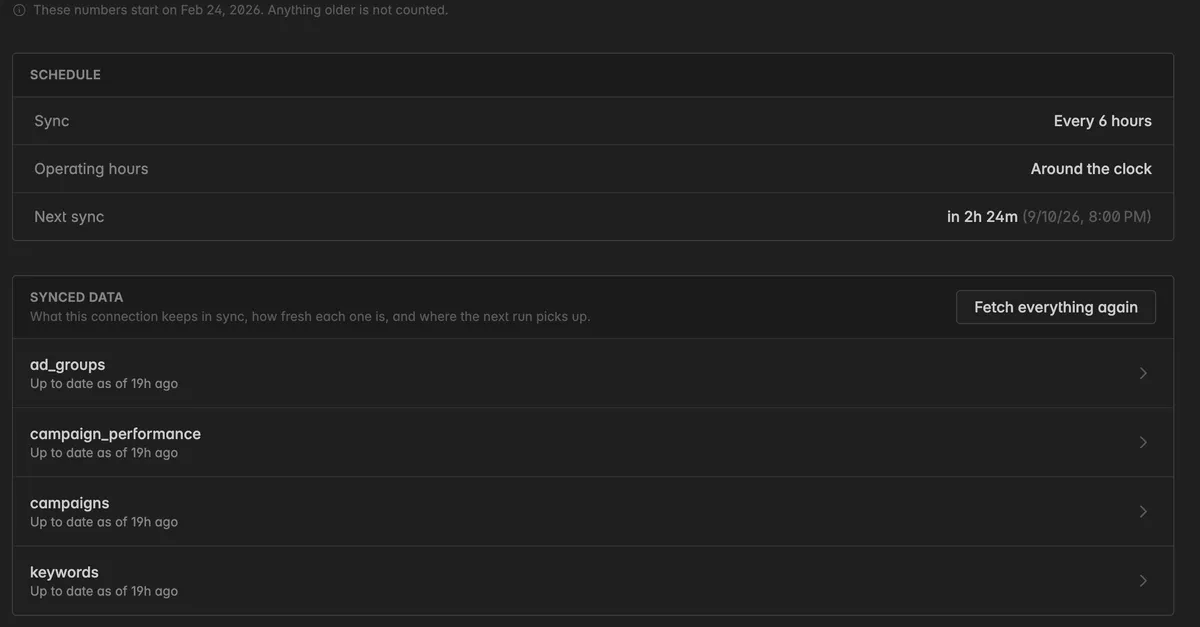
Sync: the interval, for example Every hour, Every 6 hours, or Every day.
Operating hours: Around the clock, or Between 6:00 and 22:00 only for sources that should not be queried at night.
Next sync: when the next run is due.
The schedule is set for the integration and shown here for reference. Some sources deliver data only once a day, so a shorter interval would not bring more data.
What are the synced tables?
The Synced data card lists every table the connection keeps in sync, for example campaigns, ad_groups, or keywords for an ad platform, and how fresh each one is: Up to date as of 19h ago, or Not synced yet before the first run.
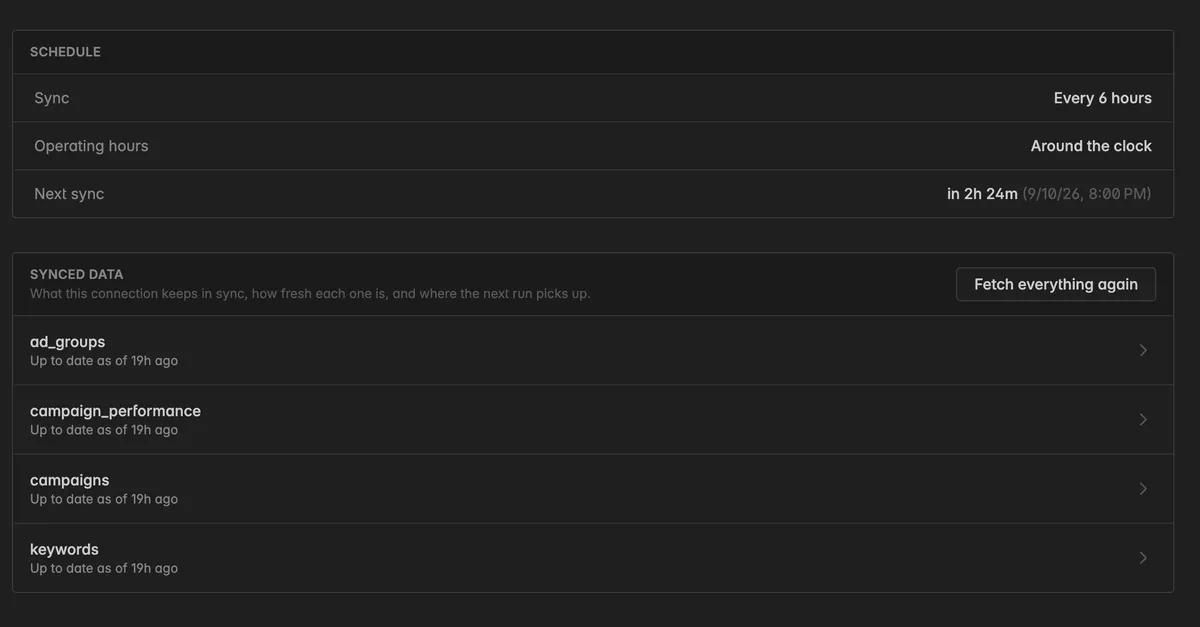
Every table remembers where the last run stopped, so the next run only fetches what is new. Click a row to see that position.
Fetch a table again
If a table looks incomplete, for example after a problem in the source system, you can make the next run load it from the beginning.
On the Synced data card, hover over the table and click Fetch again. The tooltip reads Drop the saved position so the next run loads this table from the beginning.
Or click Fetch everything again at the top of the card to do it for every table.
A toast confirms: [table] will be fetched from the beginning on the next sync. The data already in the warehouse stays until the run replaces it. To delete the data and start over completely, see Remove data from a connection.
How do I read the Activity tab?
The Activity tab is the log of everything the sync did. Open it first when a connection shows Failing.
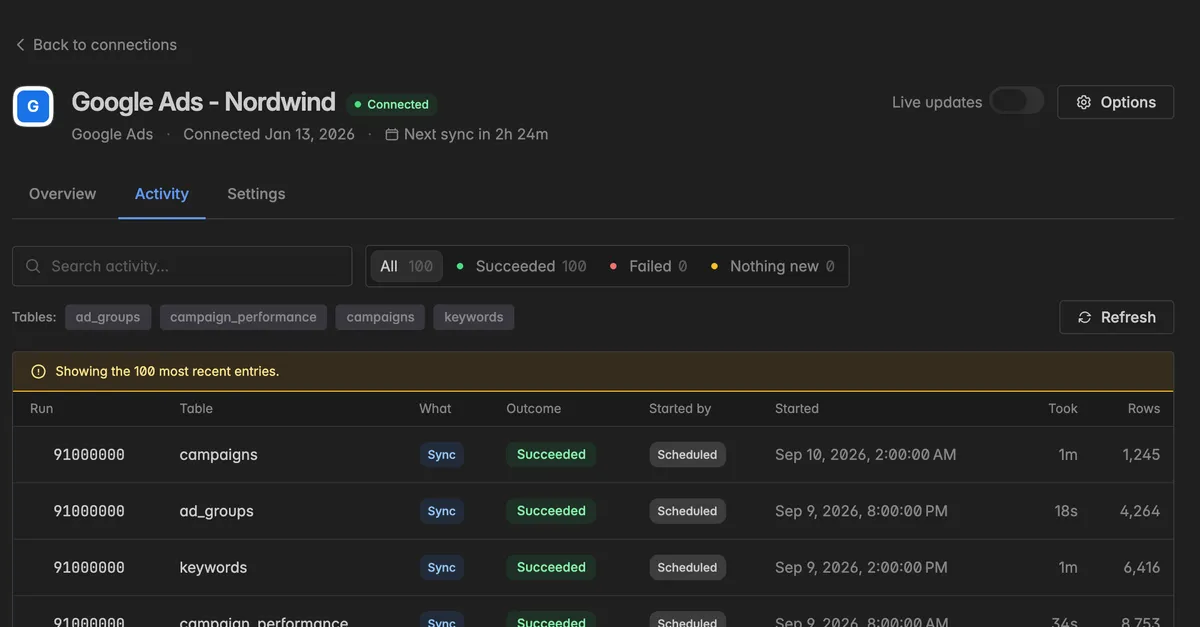
Each row is one run on one table:
Run: the id of the run.
Table: the table it wrote to.
What: Sync for a normal run, Structure change when the source added, removed, or renamed a field, Data reset after a fetch again, Status change when the connection was paused or resumed.
Outcome: Succeeded, Failed, Nothing new when the source had no new rows, Pending while the run is queued.
Started by: Scheduled, Started by hand, or Automatic.
Started, Took, Rows, and Volume.
Filter with All, Succeeded, Failed, and Nothing new, click a table chip under Tables to see one table only, or type into Search activity…. Refresh reloads the list. Click a failed row to read the error the source returned.
Note: The list shows the 100 most recent entries. How far back it reaches depends on your plan, up to 14 days.
What if a run hangs?
A run that has been Syncing for far longer than usual can be ended by hand.
Open the connection, click Options, and select Stop the sync.
Read the dialog Stop the running sync. Stopping mid-run is not a clean stop: work in progress is abandoned, data being written is left incomplete, Insights may show partial numbers, and a full re-sync may be needed afterwards.
Click Stop the sync.
Only the current run ends. The connection stays healthy and keeps its schedule, so the next sync goes ahead as normal. If numbers look off afterwards, use Fetch everything again.
How do I fix a failing sync?
Open the Activity tab, filter by Failed, and read the error. Most causes sit in the source system: expired credentials, revoked API access, or a rate limit.
Fix the cause. For credentials, open Settings, enter the new ones, and click Check and save.
Back on the Overview tab, click Clear the error. In the Options menu the same action reads Clear the error and resume.
Wait for the next scheduled run, or click Options → Sync now on the Pro plan, and check the Activity tab for a Succeeded row.
Note: Clear the error only resets the badge. If the cause is still there, the next run fails again. Read the error first.
Troubleshooting
The connection shows Failing
- Open Activity, filter by Failed, and read the error. Fix the cause, then click Clear the error on the Overview.
Some tables show Not synced yet
- The first run has not reached them. Wait for the next scheduled run, or click Sync now on the Pro plan.
My data looks incomplete
- Open Activity and look for Failed or Nothing new rows on the affected table. If the source had a problem, click Fetch again on that table under Synced data so the next run reloads it.
Sync now or the full activity history is missing
- Both need the Pro plan. On other plans the connection syncs on its schedule and the Activity tab reaches back a few days only.
The Options menu shows different entries than described
- The menu follows the state of the connection: a paused one offers Resume syncing, a failing one Clear the error and resume, a running one Stop the sync. Delete connection needs the Admin role.
Was this helpful?