
Build a custom KPI in KPI Studio
Create a KPI collection, write a metric definition in the studio, add grouping and perspective dimensions, dry run, save, and share the collection.
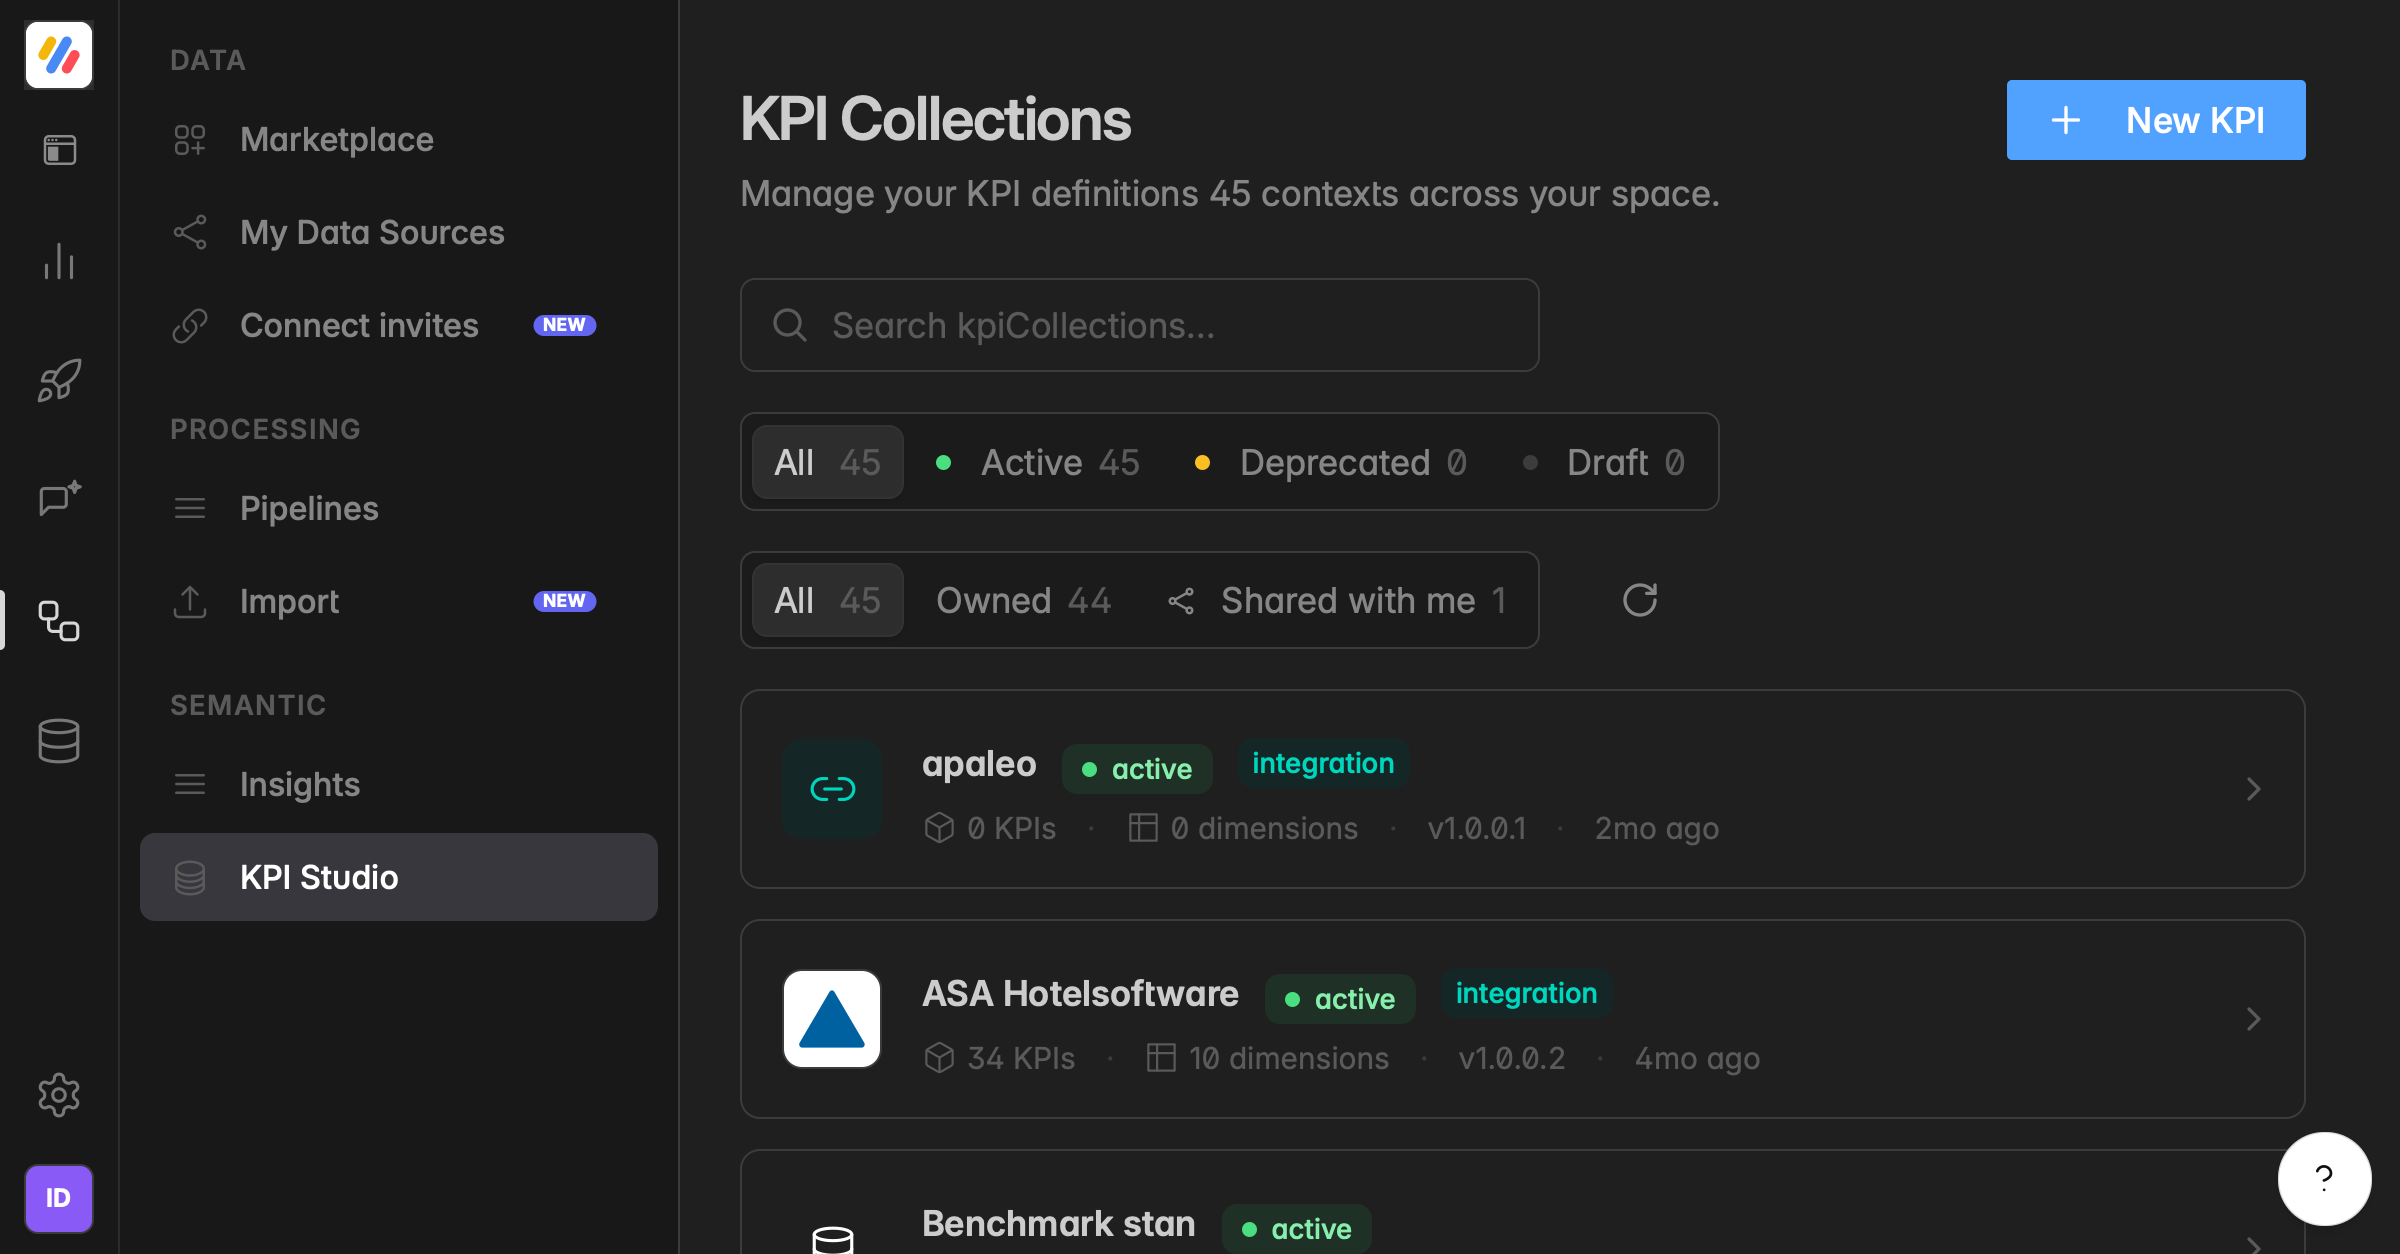
What is KPI Studio?
KPI Studio is where custom metrics are defined. A KPI collection groups metrics and dimensions that belong together, and each metric in it holds one definition plus the dimensions it can be sliced by. The studio is the editor for one metric: the definition on the left, the warehouse tables on the right, and a dry run to test it.
You find it under Data sources → KPI Studio. The page KPI Collections lists every collection in your space with its status, Active, Deprecated, or Draft, whether it is Managed or custom, how many metrics and dimensions it holds, its version, and whether you own it or another space shared it.
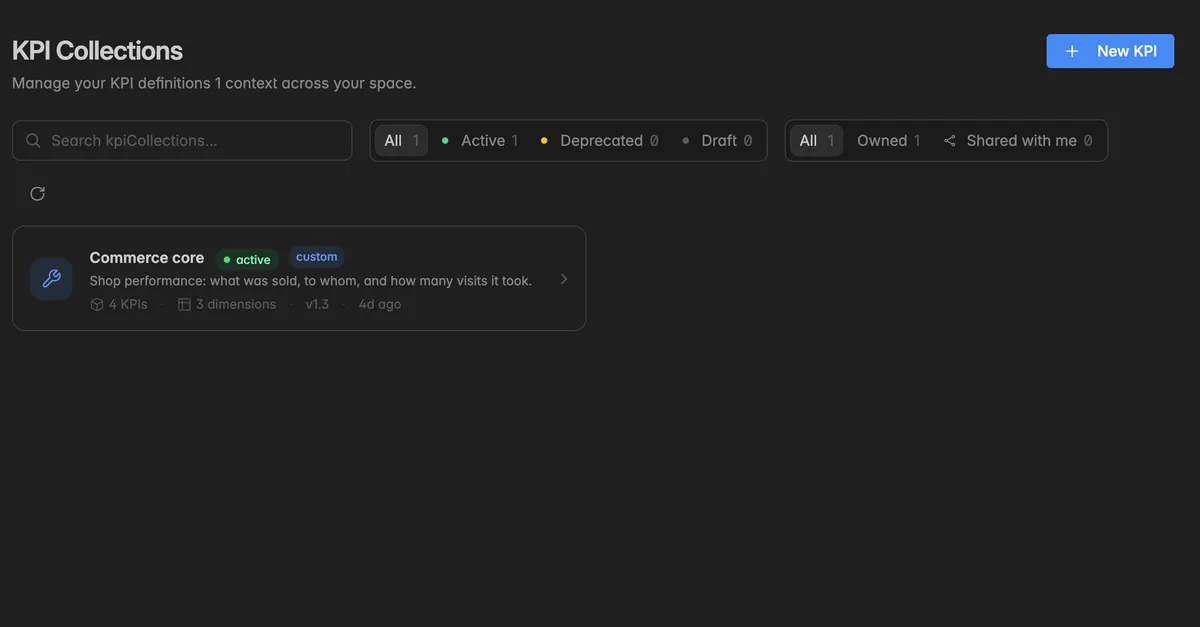
Managed or custom: collections that come with an integration are built and maintained by Indicate and cannot be edited. A collection you create is custom, and you are responsible for its definitions and dimensions. See Metrics.
When do I need a custom metric?
The managed integration does not deliver the number you need, for example a metric that combines fields in your own way.
You want a business-specific definition, for example your own definition of a qualified request.
You need a metric on top of data that only exists in your warehouse, for example an imported file.
You uploaded your own data and want AI assistants to read it. Assistants see Insights, never raw tables, so a metric is the way in.
Where is the documentation?
Metrics are declarative JSON, not SQL text. They are written in the DSL of the semantic layer, which compiles into a query with SQL semantics. Every metric filters on _connection_id, so it returns data for one source connection only.
The DSL language reference: docs.indicate-data.io/reference/semantic-layer. Statements, expressions, functions, data types, and schema.
How metrics are built: github.com/insanetic/data-max. The workflow from a raw file to a finished metric and dimension definition, packaged as three skills for AI assistants.
Build metrics with the data-max skills
The repository is a plugin with three skills. Let an AI assistant do the heavy lifting, from a raw export to a finished definition.
Install in Claude Code: run /plugin marketplace add insanetic/data-max, then /plugin install data-max@data-max. For other agents, copy the folders from skills/ into your agent's skills folder.
data-review inspects a raw export, CSV, TSV, JSON, XML, or Excel, and reports how to clean it for a warehouse. It never changes your data.
data-transform executes that review and turns the file into clean, warehouse-ready tables.
metric-creator builds DSL-compatible metric and dimension definitions on top of clean data. It produces versioned JSON metric files and a
dimensions.mdwith the matching dimensions.
metric-creator needs the DDL of your tables as input. Open the table on the Data page, click More actions → Show DDL, and copy the
CREATE TABLEstatement. See Data Studio.
How do I create a KPI collection?
You need the User role or higher, and a plan that includes custom metrics.
Click the database icon in the left rail to open Data sources, then click KPI Studio.
Click New KPI at the top right.
In the dialog New KPI Collection, enter a Display name, for example
Commerce core, and optionally a Description.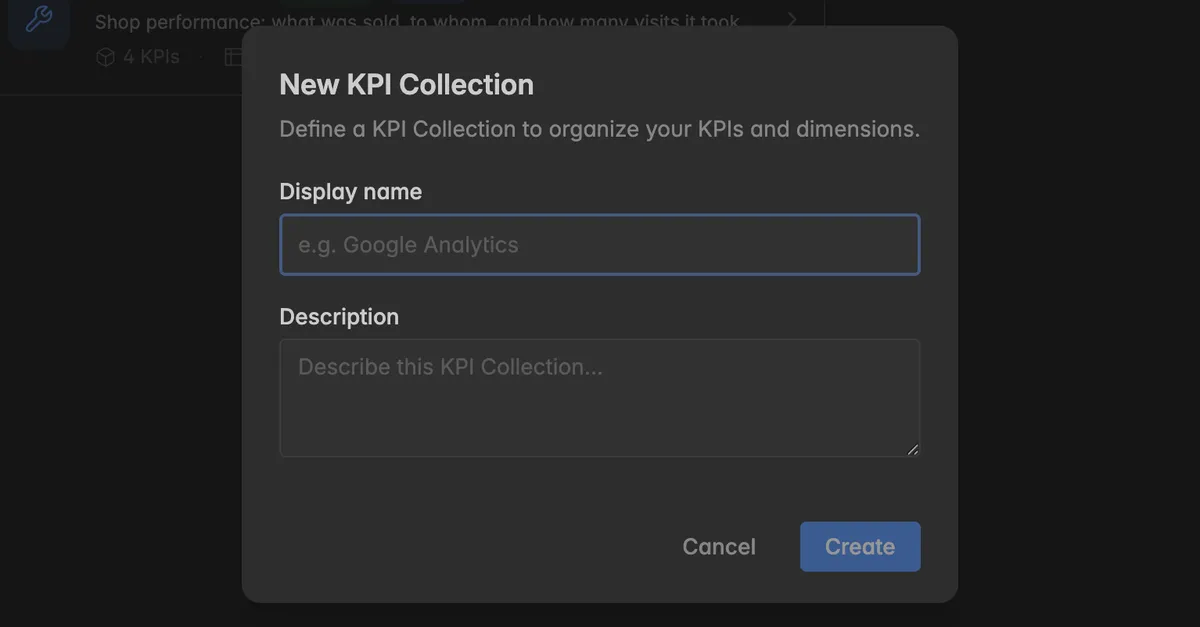
Click Create.
The collection opens with the tabs KPIs, Dimensions, Sharing, and Settings.
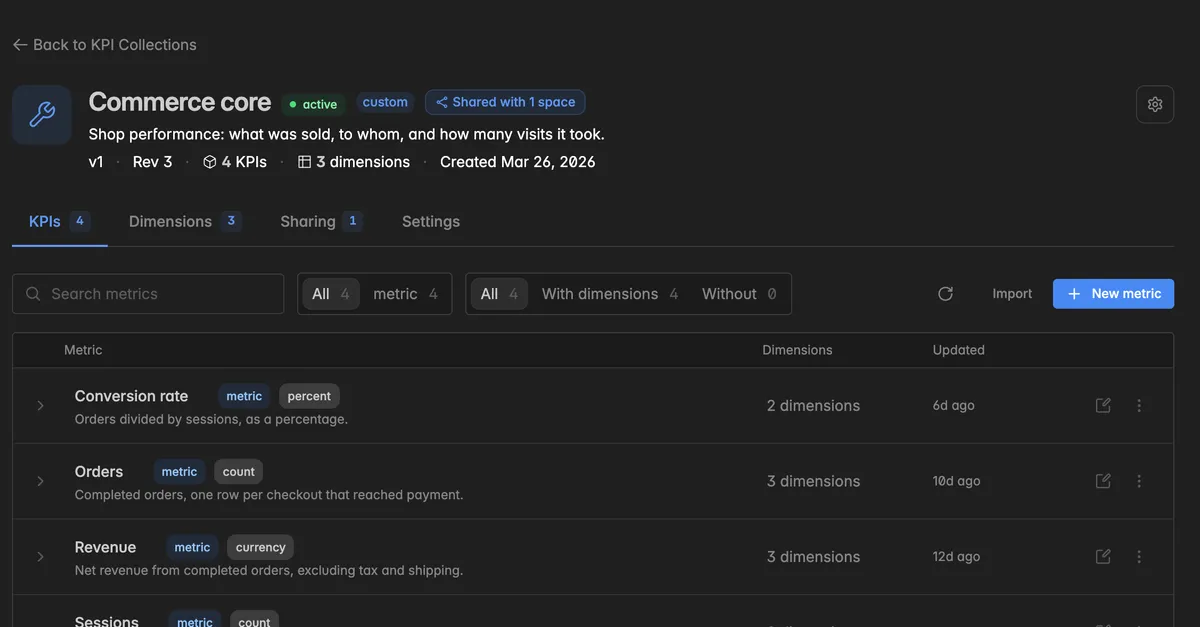
How do I create a metric?
Open the collection and stay on the KPIs tab.
Click New metric.
In the dialog New KPI, enter a Display name, for example
Conversion rate, and optionally a Description. Click Create.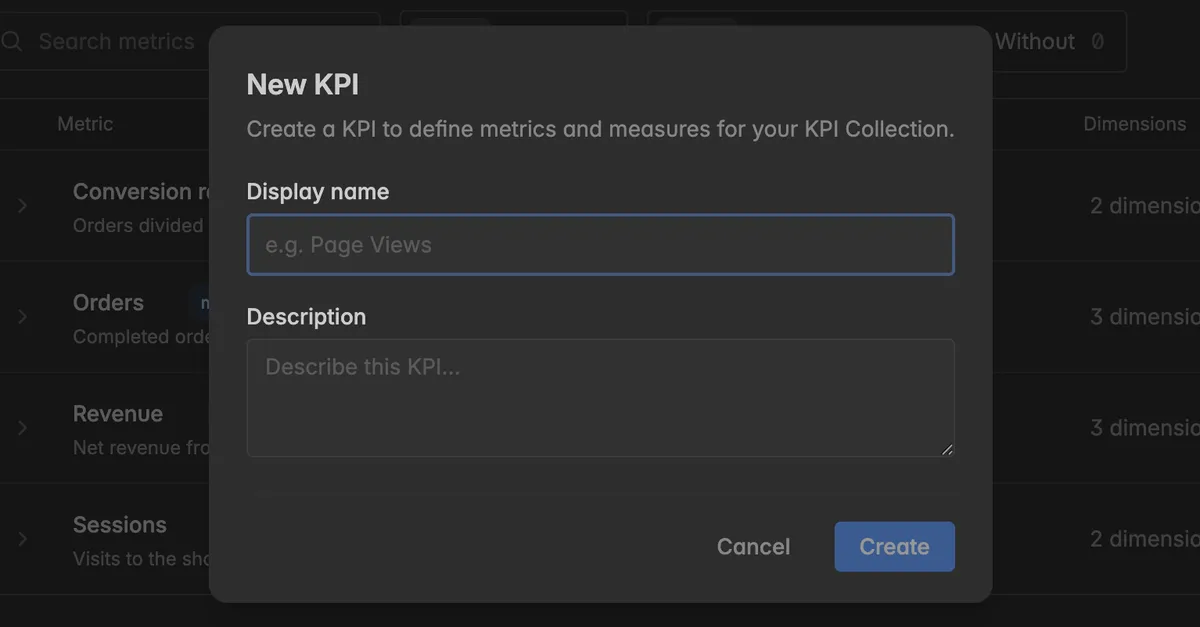
Hover over the metric in the list and click Edit in studio, or click
⋮→ Edit in studio. The same menu offers Duplicate to copy a metric into this or another collection.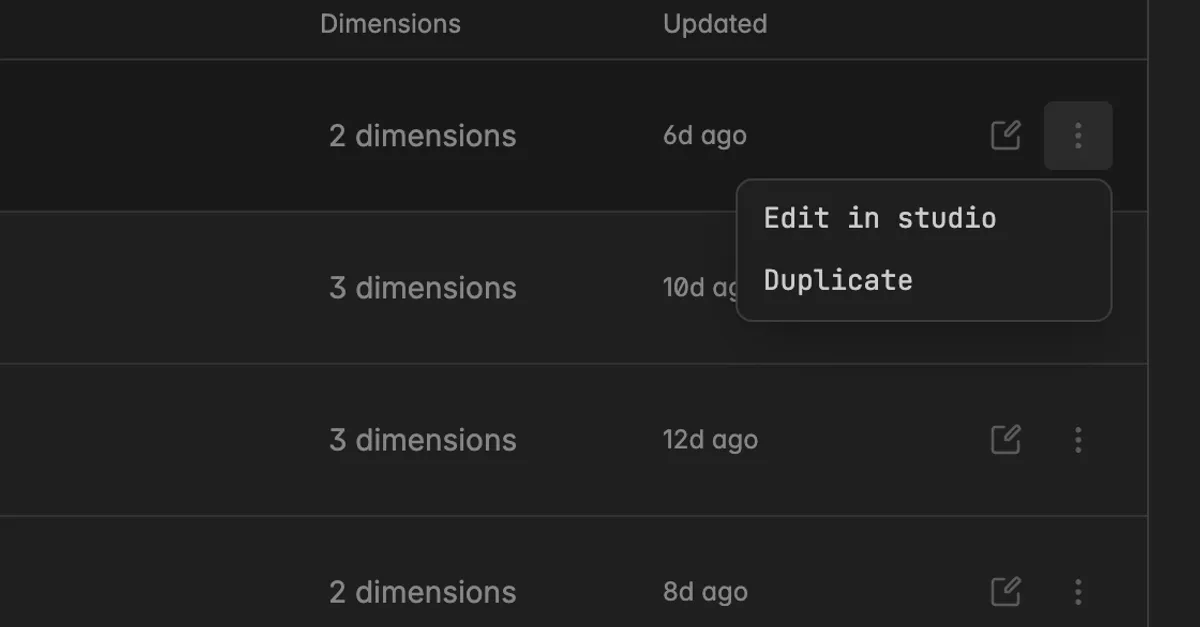
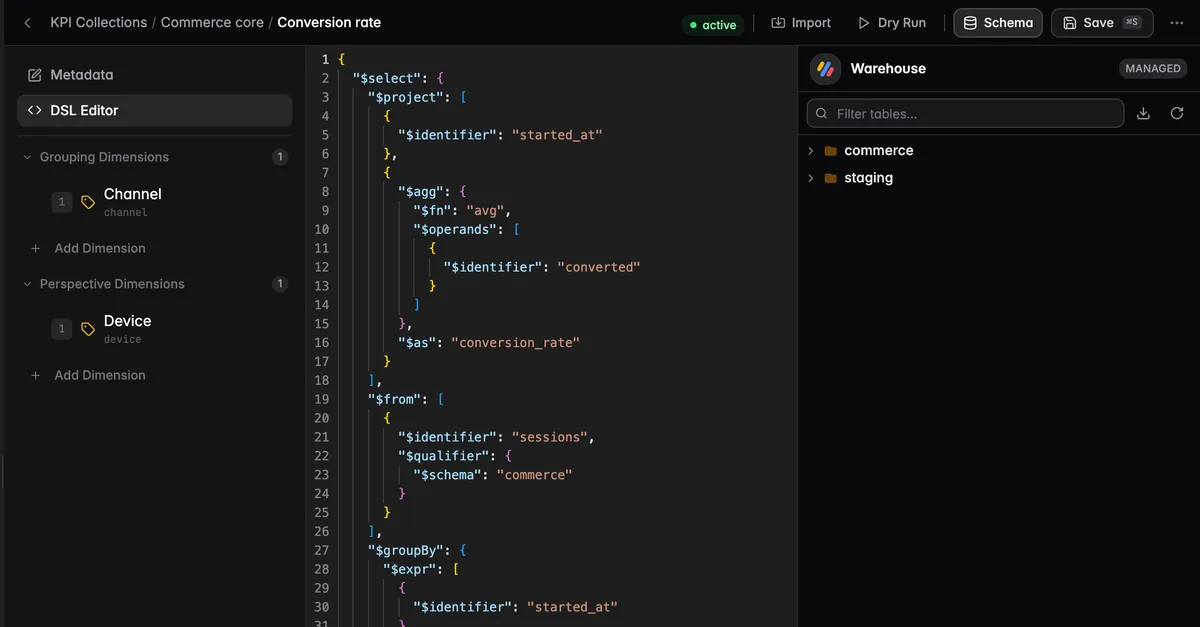
The studio opens. On the left: Metadata, DSL Editor, Grouping Dimensions, and Perspective Dimensions. In the middle: the editor. On the right: the Warehouse panel with the schemas and tables of your space. The top bar holds Import, Dry Run, Schema, and Save.
How do I write the definition?
Click DSL Editor and write the definition in the editor. Use the DSL reference, or let the metric-creator skill draft it.
Expand the schemas in the Warehouse panel on the right to check the exact table and column names. Schema in the top bar opens the full schema view.
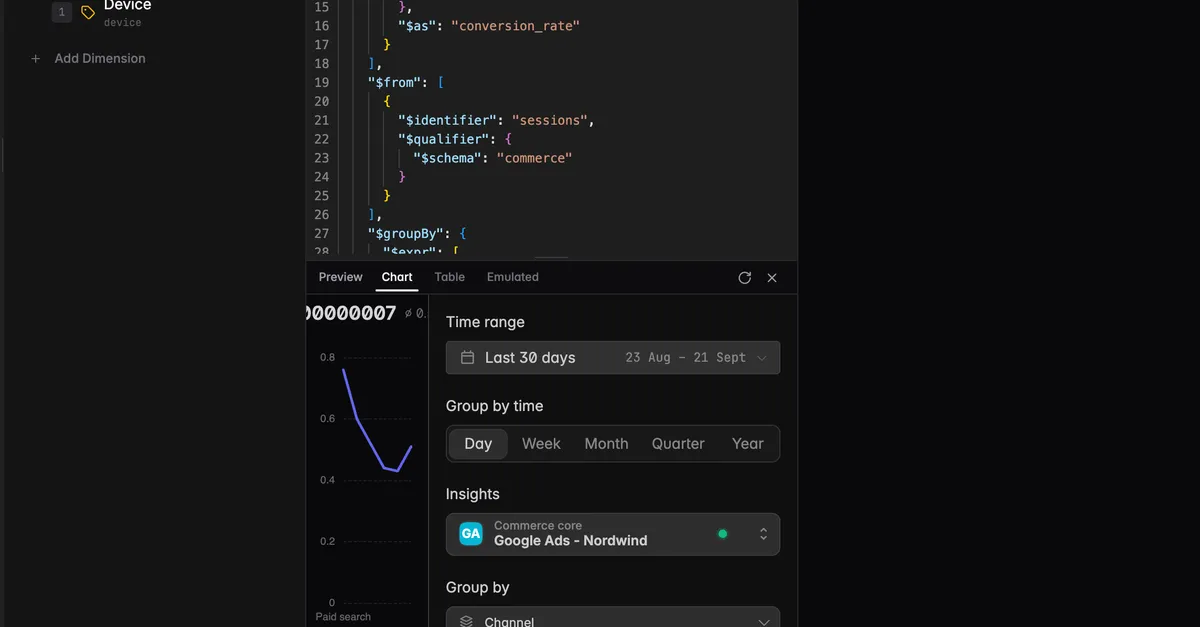
Click Dry Run. The definition runs without being saved. A result pane opens at the bottom with the tabs Preview, Chart, Table, and Emulated, and controls for Time range, Group by time, Insights, and Group by to see how the metric behaves. These settings are for testing only.
Errors appear under the editor, with the failing statement.
What are grouping and perspective dimensions?
Both are dimensions, but they do different jobs:
Grouping dimensions decide how the data is split: they go into the
GROUP BYof the query, for example the channel on the x axis.Perspective dimensions decide which data is included: they go into the filters, for example whether a time range filters on the booking date or the arrival date.
Every metric needs at least one of each. If the definition returns a column no dimension maps to, the metric fails to run. See Grouping and perspective for how they appear in a widget.
How do I add a dimension?
In the studio, click Add Dimension under Grouping Dimensions or Perspective Dimensions. A menu offers two ways:
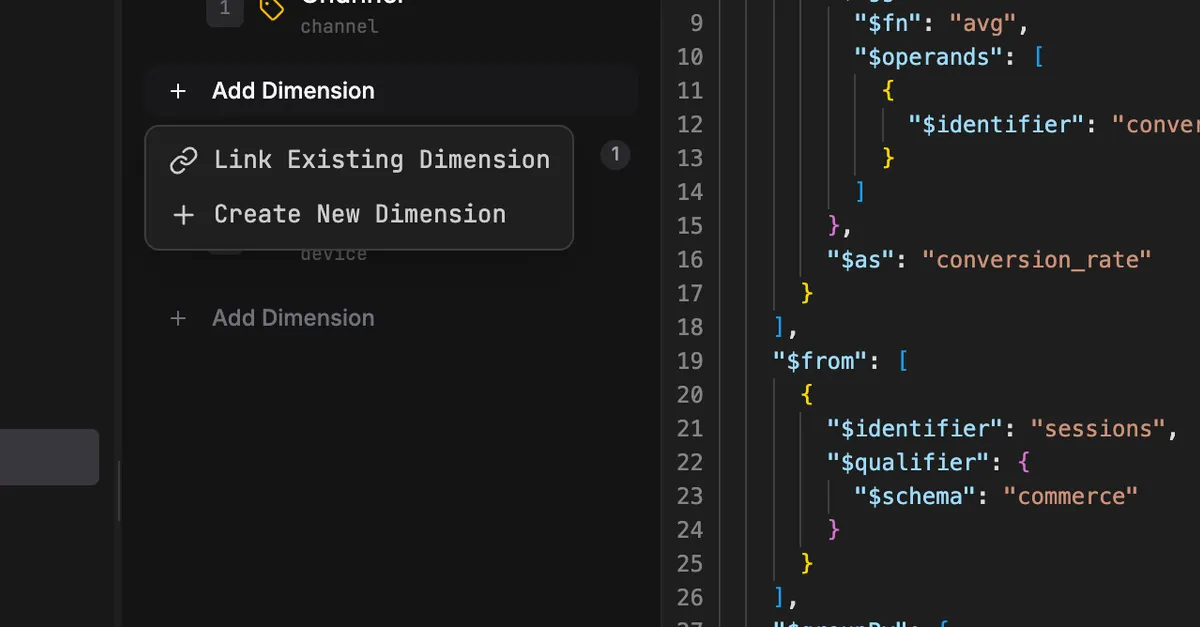
Link Existing Dimension: pick one or more dimensions the collection already has. The dialog Link existing dimensions lists them with Select all.
Create New Dimension: define a new one. The same dialog opens from New dimension on the collection's Dimensions tab.
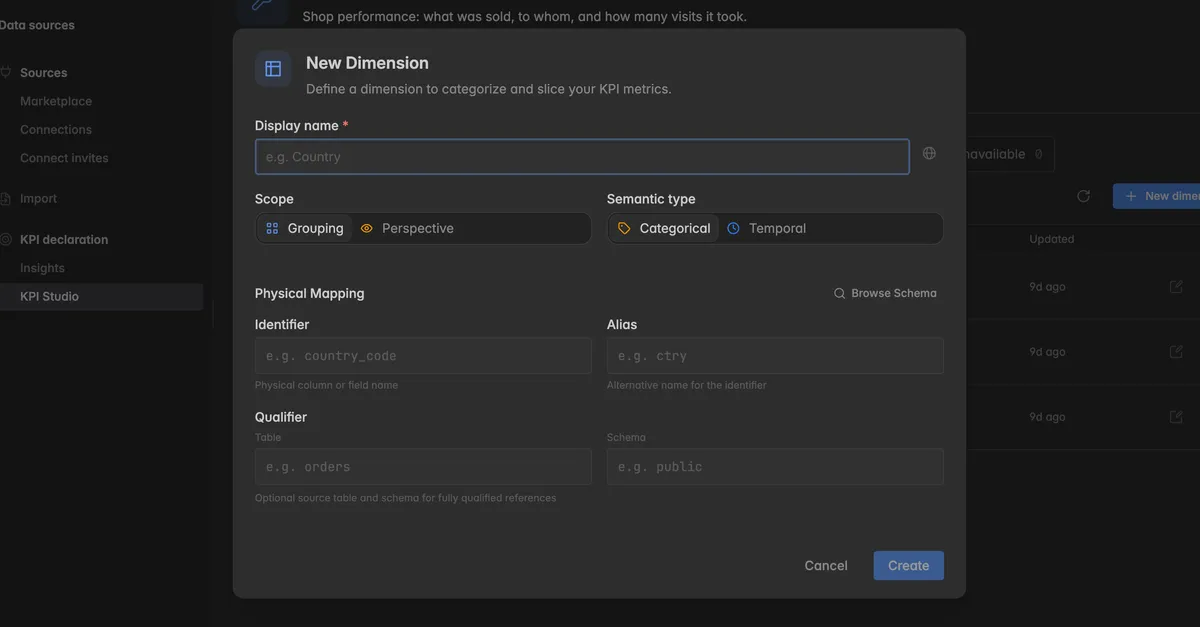
To create a dimension:
Enter a Display name, for example
Channel. This is what users see.Pick the Scope, Grouping or Perspective. It is preselected from the section you started in.
Pick the Semantic type: Categorical for discrete values such as channel or country, Temporal for date and time columns. Temporal dimensions are what the time range and the granularity work on.
Under Physical Mapping, enter the Identifier, the exact column name, and the Alias, the label the column is projected as in your definition. Click Browse Schema to pick the column instead of typing it.
Optionally, under Qualifier, enter the Table and Schema so the column is fully qualified. Use the same table alias as in the
$fromof your definition.Click Create.
A typo in Identifier or Alias is the most common reason a metric does not run. If you built the definition with metric-creator, take both from the generated
dimensions.md.
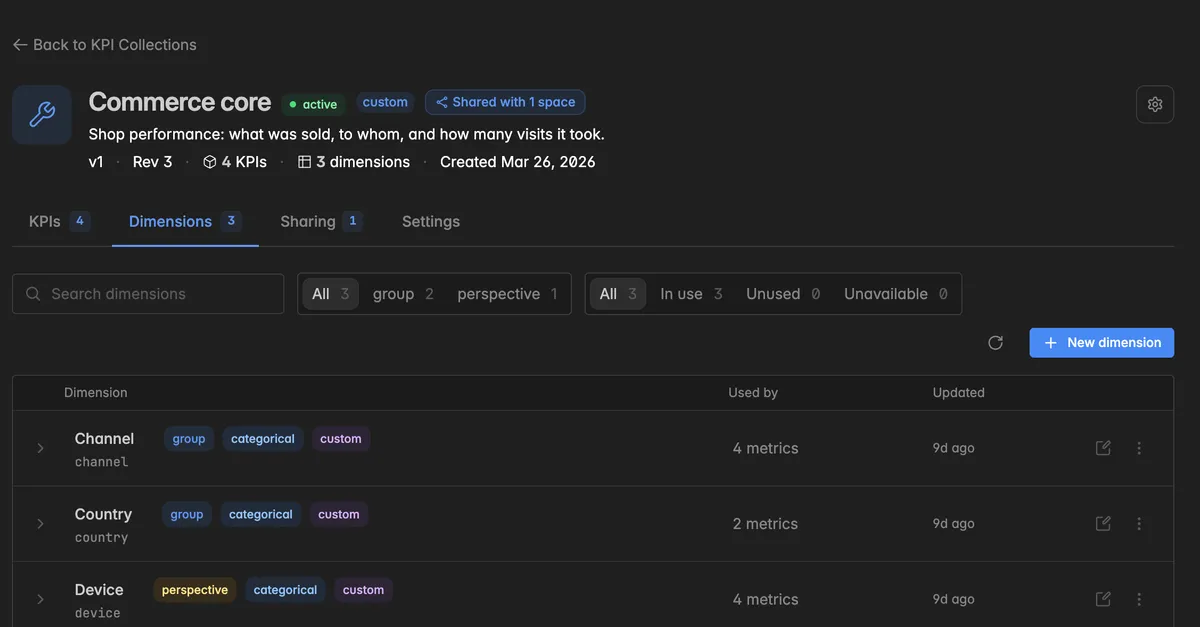
The collection's Dimensions tab lists every dimension with its scope, type, the column, and how many metrics use it. Hover over a row for Edit, and click ⋮ for Add to metrics, Duplicate, and Delete. The filters In use, Unused, and Unavailable find dimensions no metric uses.
How do I save the metric?
Click Save in the top bar, or press ⌘ S on macOS and Ctrl S on Windows.
To use the metric in widgets, the chat with Resi, and AI assistants, the collection has to be published as an Insight. See Publish a KPI collection as an Insight.
How do I share a KPI collection with another space?
A collection can be shared read-only, so another space can browse it and publish its own Insights on it.
Open the collection and click the Sharing tab.
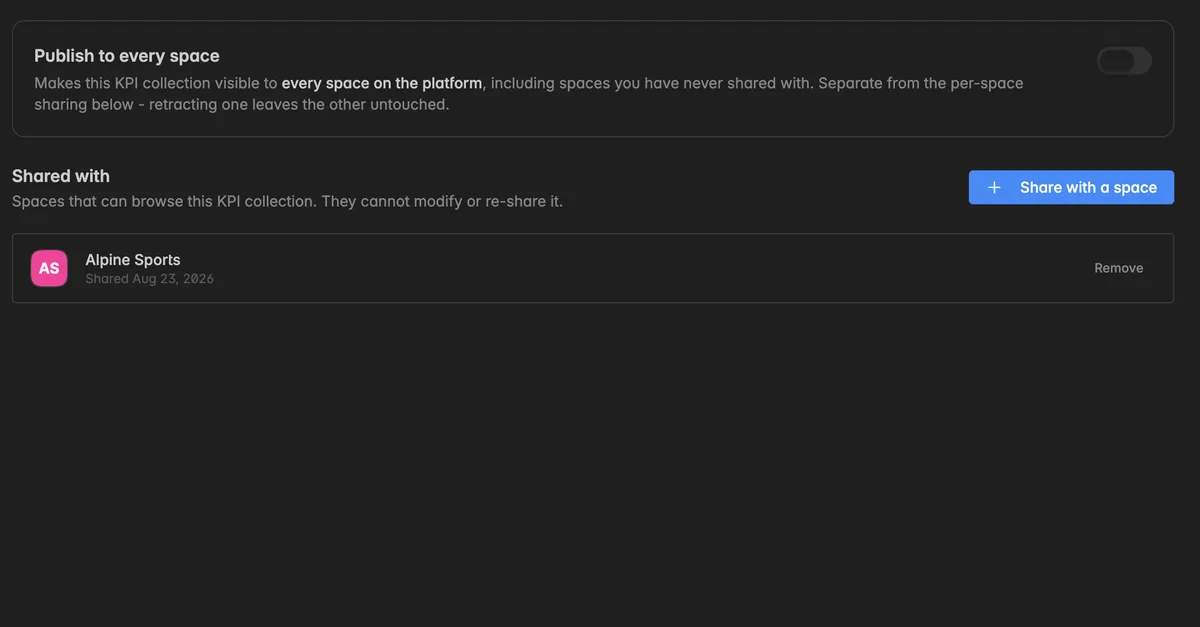
Click Share with a space, pick the space under Space, and click Share. Only spaces you have access to are listed. The space gets read-only access immediately and cannot modify or re-share the collection.
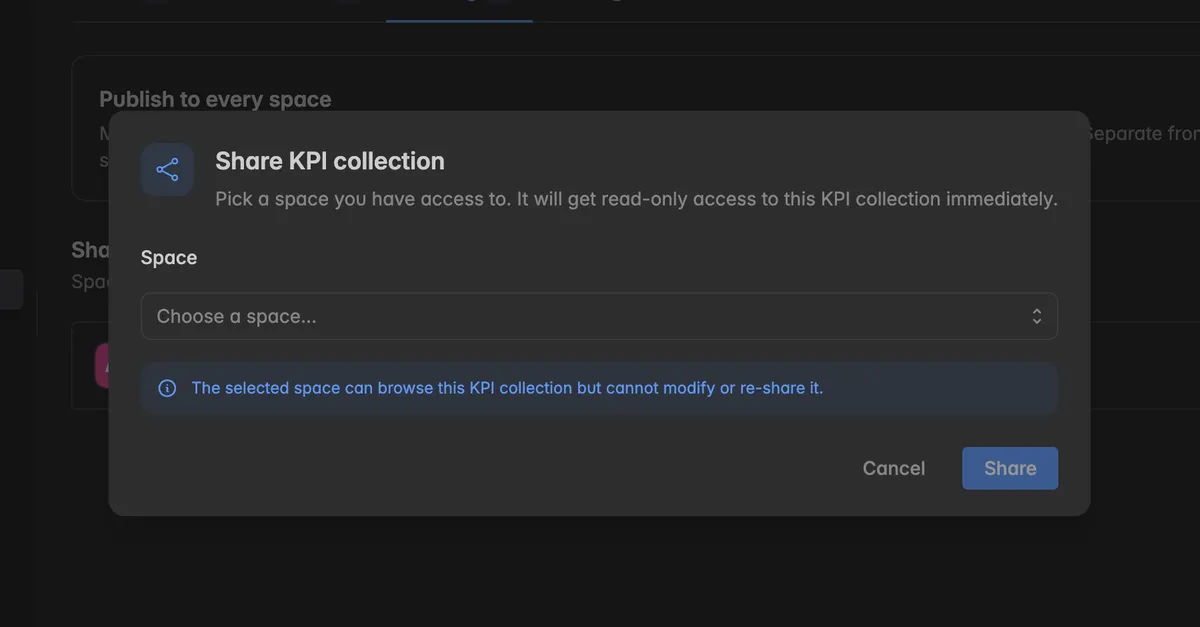
Click Remove next to a space to take the access away again.
Publish to every space at the top makes the collection visible to every space on the platform. It is separate from the per-space list, retracting one leaves the other untouched.
Sharing a collection shares the definitions, not the data. To give another space your numbers, share the Insight instead, see Share Insights.
Troubleshooting
Dry Run fails with "Failed to execute KPI collection query"
- The message under the editor contains the generated query. In most cases an alias or a table in the definition does not exist. Compare Alias and Identifier of every dimension with the names in your definition, correct them with Edit on the Dimensions tab, and run Dry Run again.
A referenced table is not found
- Open the dimension, expand Qualifier, and set Table and Schema so the column is fully qualified. The table alias has to match the
$fromof your definition. Look the table up in the Warehouse panel.
I do not know which column name to use
- Expand the schema in the Warehouse panel, or open the table on the Data page and switch to Schema. More actions → Show DDL copies the whole
CREATE TABLEstatement.
My metric returns no data
- Check that the definition filters on
_connection_idand that the Insight built on the collection has a source connection assigned.
My metric does not appear in a widget
- A metric in KPI Studio is a definition. It becomes usable once the collection is published as an Insight. See Publish a KPI collection as an Insight.
New KPI or Edit in studio is missing
- Creating and editing needs the User role or higher and a plan that includes custom metrics. Managed collections, and collections another space shared with you, are read-only.
Was this helpful?