
Publish a KPI collection as an Insight
Turn a KPI collection into an Insight with Create Insights: name, collection, source connection, arguments, and how to check it works.
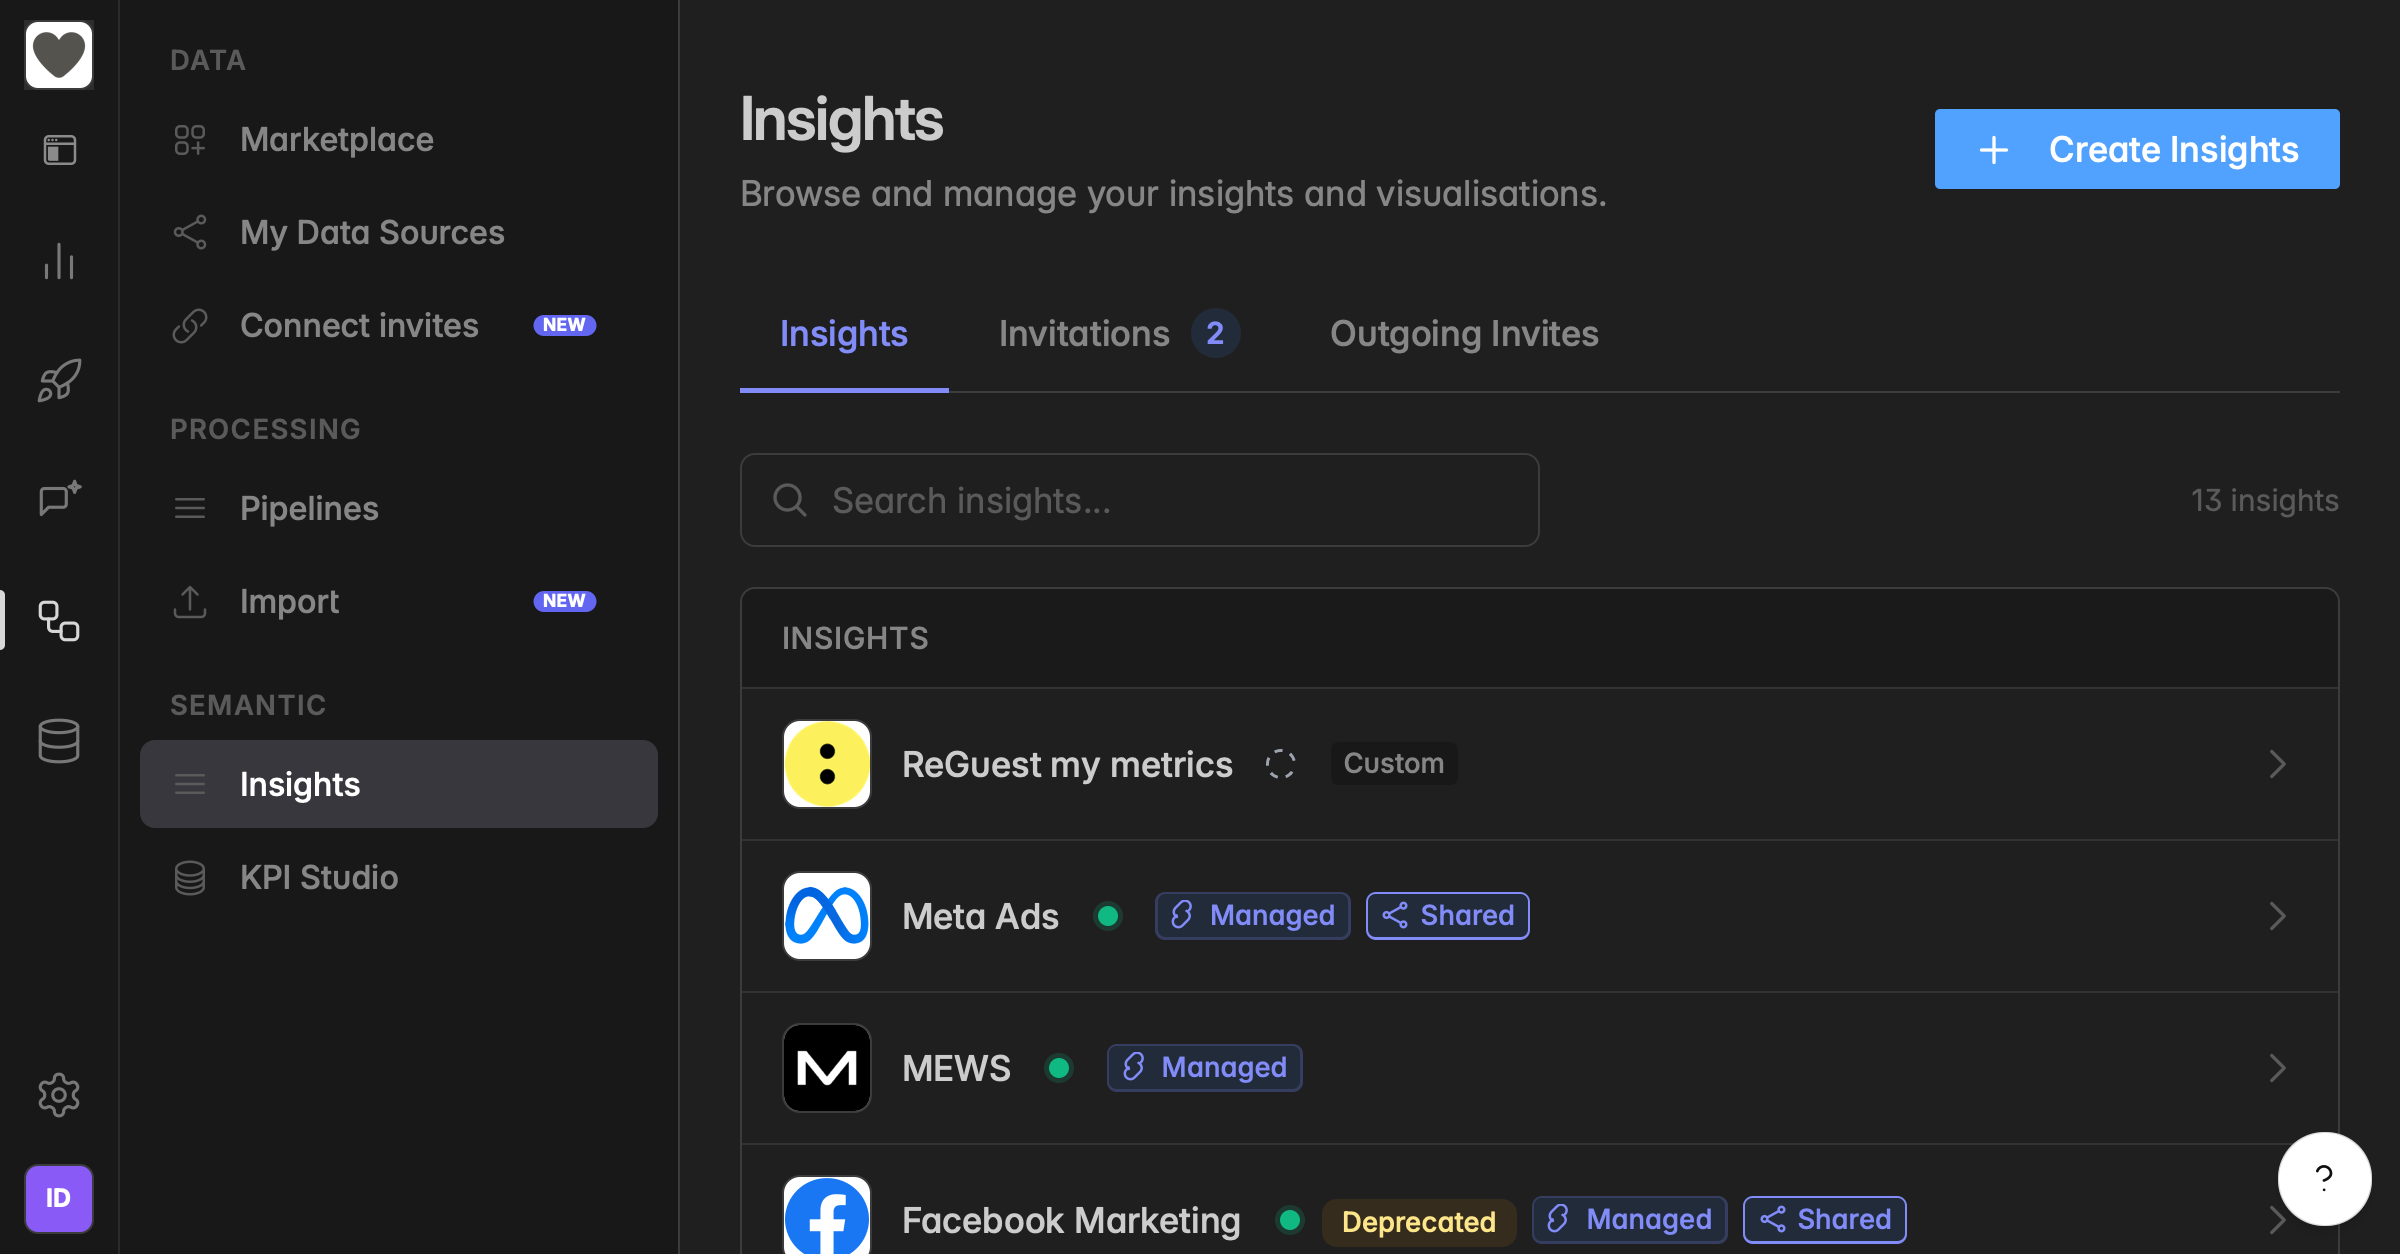
What does publishing do?
A KPI collection holds definitions. An Insight makes them usable: it takes the collection, connects it to the source connection that delivers the data, and offers the metrics to widgets, Resi, and AI assistants. Every custom collection needs at least one Insight before anyone sees a number.
You find your Insights under Data sources → Insights, with the badges Managed for Insights that came with an integration and Custom for the ones you published. See Insights for the page itself.
When do I need this?
You built a custom KPI collection in KPI Studio and want its metrics in dashboards and widgets.
You want Resi or an external AI assistant to read metrics on your own data.
You want the same collection on two connections, for example two shops. One Insight per connection.
How do I create an Insight from a KPI collection?
Save the metrics in KPI Studio first. You need the User role or higher.
Click the database icon in the left rail to open Data sources, then click Insights.
Click Create Insights at the top right. The page Create Insights opens.
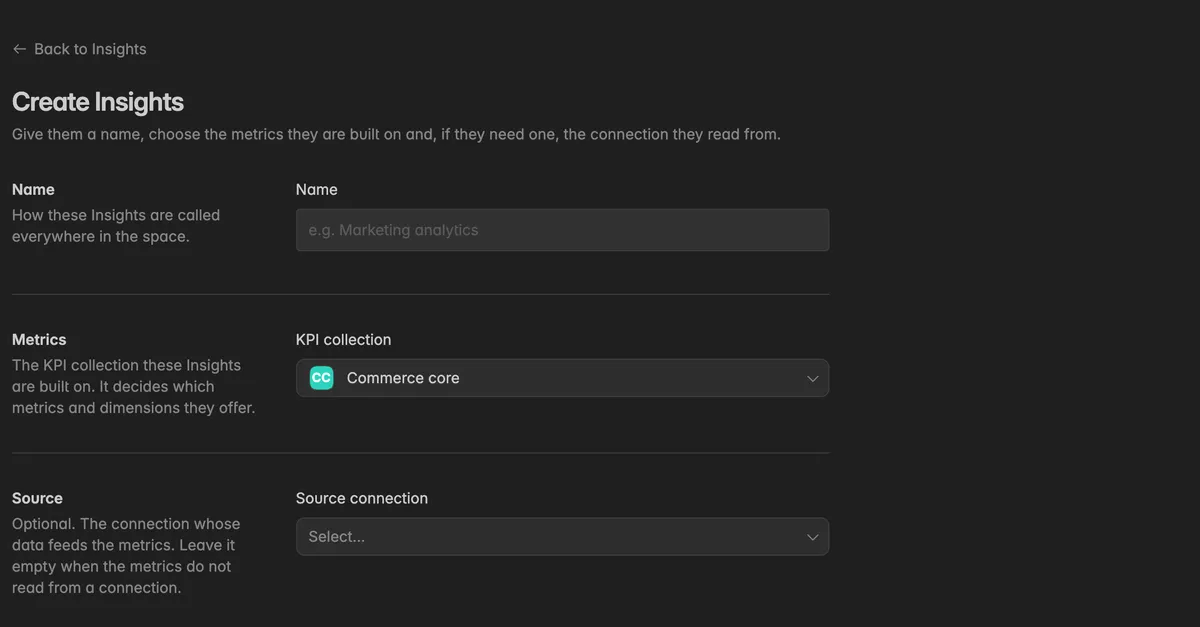
Enter a Name, for example
Commerce core. This is how the Insights are called everywhere in the space.Under Metrics, pick the KPI collection. It decides which metrics and dimensions the Insights offer. If the list is empty, click Go to KPI collections and create one first.
Under Source, pick the Source connection whose data feeds the metrics. Leave it empty when the metrics do not read from a connection, for example on an imported table.
Under Advanced, click Add argument only if a metric definition asks for one. Arguments are variables a definition refers to by name, and their value is injected at runtime. Use them for values that should not be visible in the definition, or to isolate tenants per connection.
Click Create Insights.
The Insight appears in the list with the badge Custom and opens on its Insights tab.
How do I check that the Insight works?
On the Insights tab, pick a metric on the left. The panel loads the figures for the period, Sum, Mean, Median, Min, Max, Count, First, and Last, and a chart.
Change the time range, the grain, the grouping, and the perspective to see how the metric behaves. Nothing is saved here.
If the data loads, the Insight is ready for widgets and AI. See Insights for the Overview tab, the logo, and sharing.
How do I change the connection or add a logo later?
Open the Insight and click the Overview tab. It holds the name, the image, the KPI collection, and the source connection. Change what you need and click Save.
Troubleshooting
The metric panel says "Could not load this metric"
No source connection is assigned. Open the Overview tab, set the connection under Source, and save.
The definition fails. Open the collection under
Data sources→KPI Studio, click Edit in studio on the metric, run Dry Run, and fix the reported error. See Build a custom KPI in KPI Studio.
My KPI collection is not in the list
- Only collections of your space and collections shared with your space appear. Check under
Data sources→KPI Studiothat the collection exists and is saved.
The Insight has no metrics
- The collection has no metrics yet. Open it in KPI Studio and add one.
Create Insights is missing
- The button needs the User role or higher. Readers cannot create Insights.
I want another space to use these metrics
- Share the Insight with that space, see Share Insights. Or share the collection itself on its Sharing tab so the other space can publish its own Insight on its own connection.
Was this helpful?