
Insights
What an Insight is, where to find your Insights under Data sources, how to explore a metric, what the Overview and Sharing tabs hold, and how Insights are created, shared, duplicated, and deleted.
What is an Insight?
An Insight is a ready-to-use set of metrics and dimensions from one of your connected systems, for example Nordwind commerce with revenue, orders, sessions, and conversion rate. It sits between the raw data of a connection and your dashboards: Widgets, Resi, and AI assistants all read their numbers from Insights, never from the raw tables.
An Insight is built on a KPI collection, which defines the metrics, and optionally reads from a source connection, which delivers the data. Managed Insights come with an integration and are kept up to date by Indicate. Custom Insights are built by your team from your own KPI collection.
When do I need this?
You want to see which metrics a connected system delivers, and how a metric develops, before you build a widget.
You want to check whether an Insight is Managed by Indicate or Custom built by your team, and which connection feeds it.
You want to give another space access to your numbers, or use Insights another space shared with you. See Share Insights.
You want AI assistants such as Claude or ChatGPT to read your data. Assistants only see Insights. See Tokens.
Where do I find my Insights?
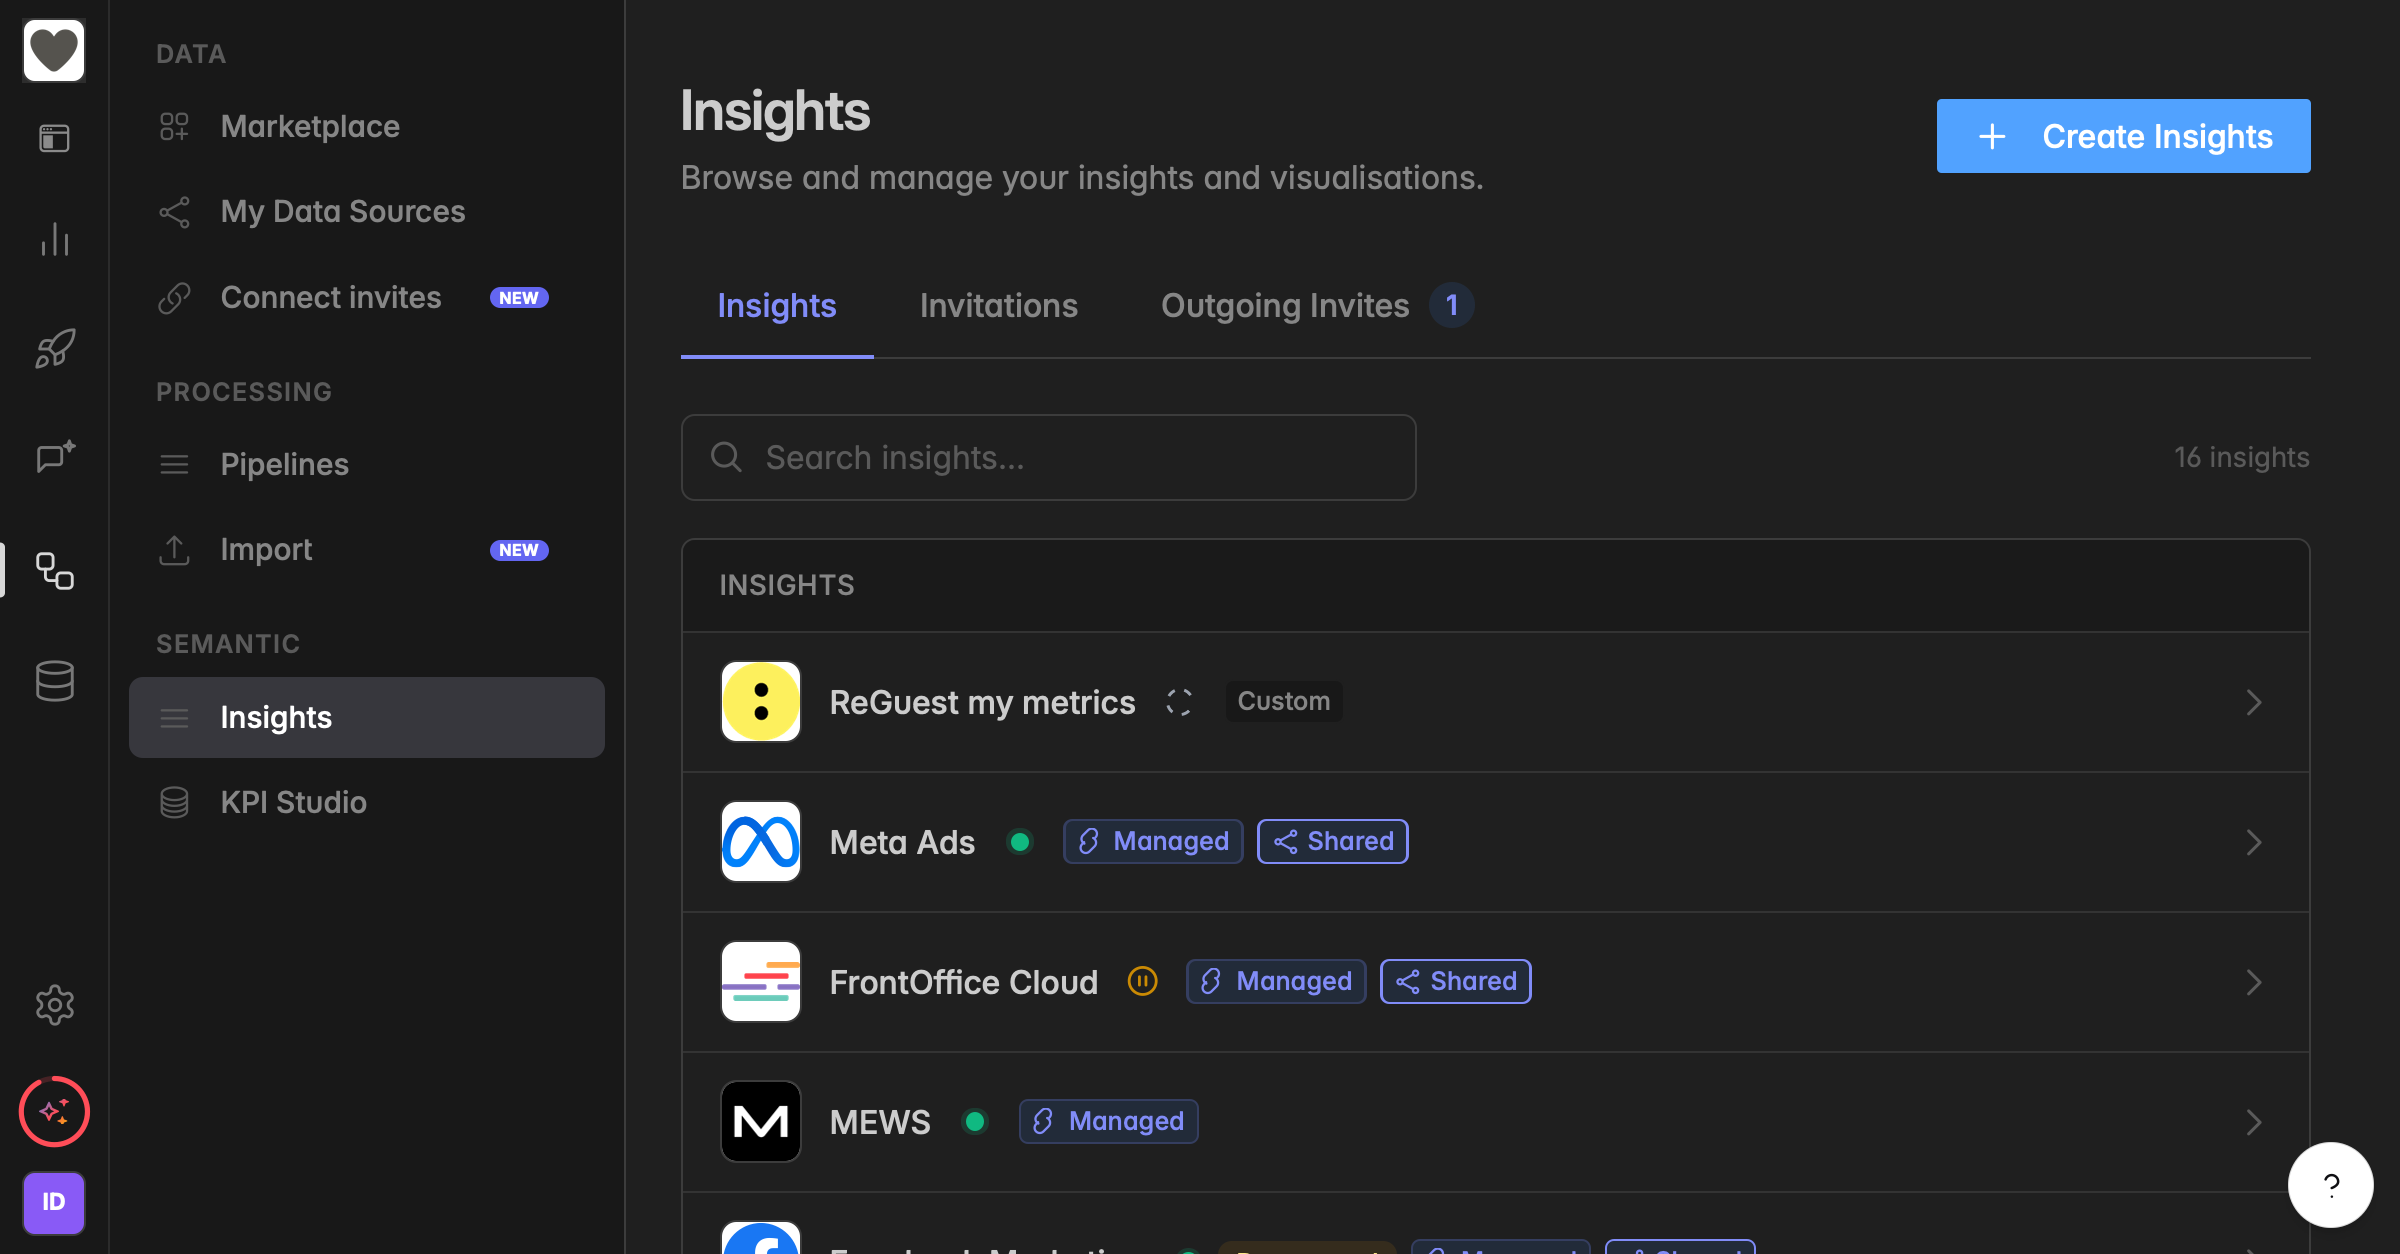
Click the database icon in the left rail to open Data sources, then click Insights. The page lists every Insight in your space, your own and the ones other spaces shared with you.
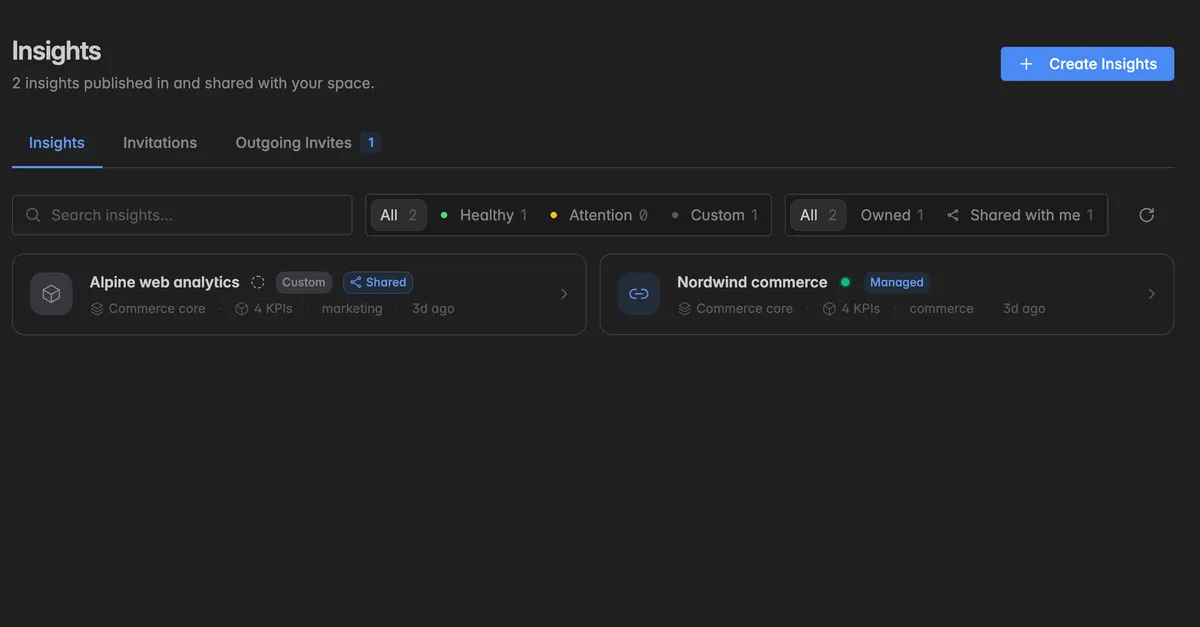
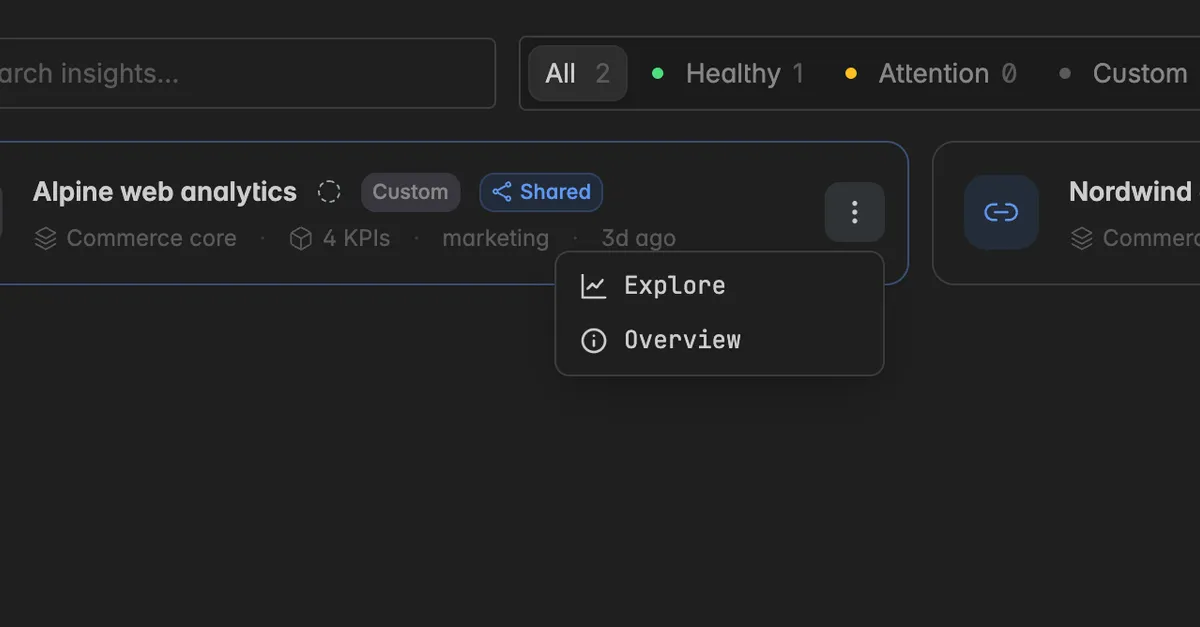
Each card shows the name and logo, the badges, the KPI collection it is built on, the number of KPIs, its tag, and when it was last updated. Click a card to open the Insight, or click the ⋮ icon on a card for Explore and Overview.
Badges
Managed: Pre-built by Indicate for an integration and kept up to date by its connection.
Custom: Built by your team from your own KPI collection. See Publish a KPI collection as an Insight.
Shared or Shared with you: Another space shared this Insight with yours.
Read-only: You can use it, but not change it. Every shared Insight is read-only.
Active: The Insight returns data. A retired Insight shows a notice instead.
Search and filters
Type into Search insights… to find one by name. The two filter groups narrow the list down:
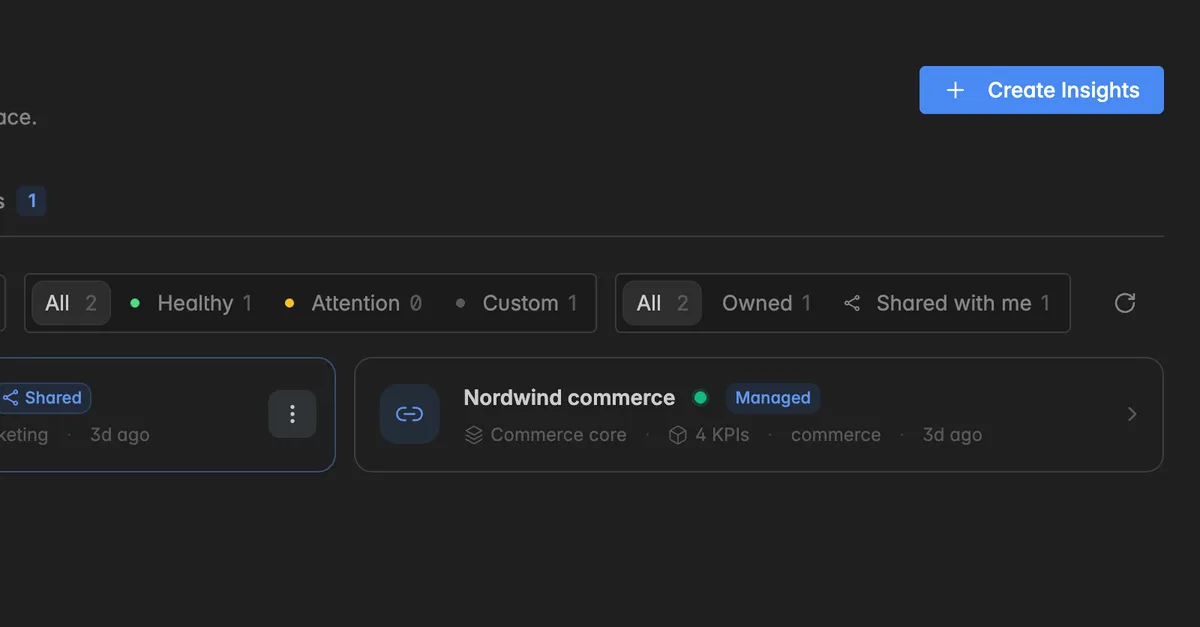
All, Healthy, Attention, Custom: By state. Attention lists Insights whose connection stopped delivering, the same ones the Home page lists under Needs your attention.
All, Owned, Shared with me: By who owns the Insight.
The number next to each filter is how many Insights it holds. Click the refresh icon to reload the list.
Invitations and outgoing invites
Two more tabs sit next to Insights at the top of the page:
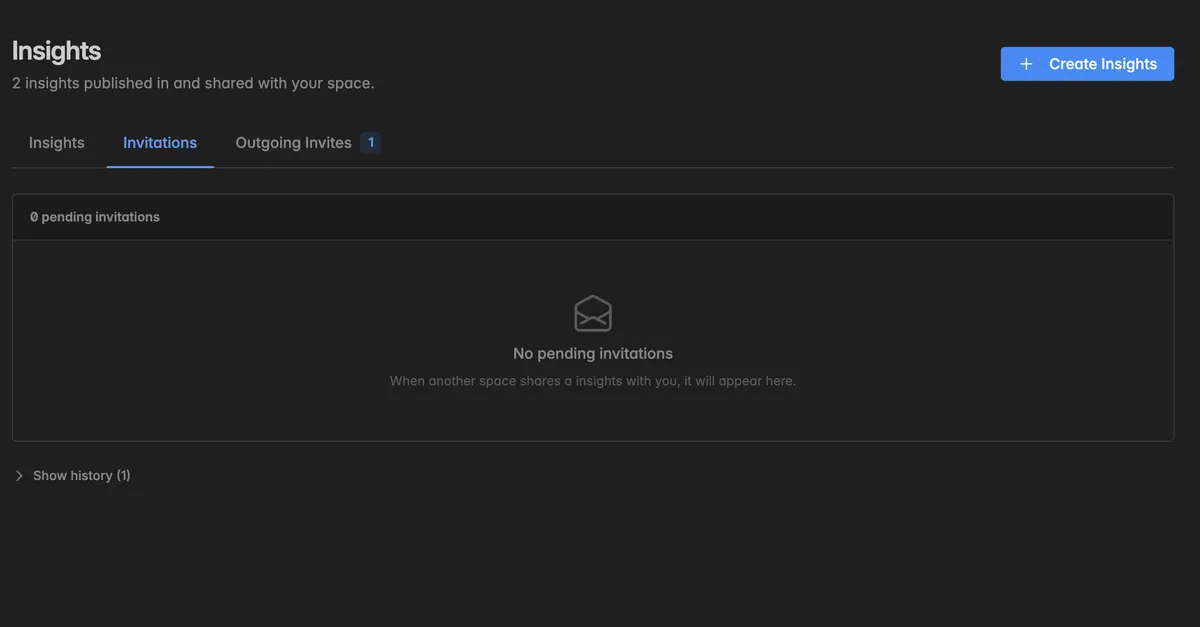
Invitations: Insights other spaces offered to you and that an admin has not accepted yet. Show history lists the ones already accepted or declined.
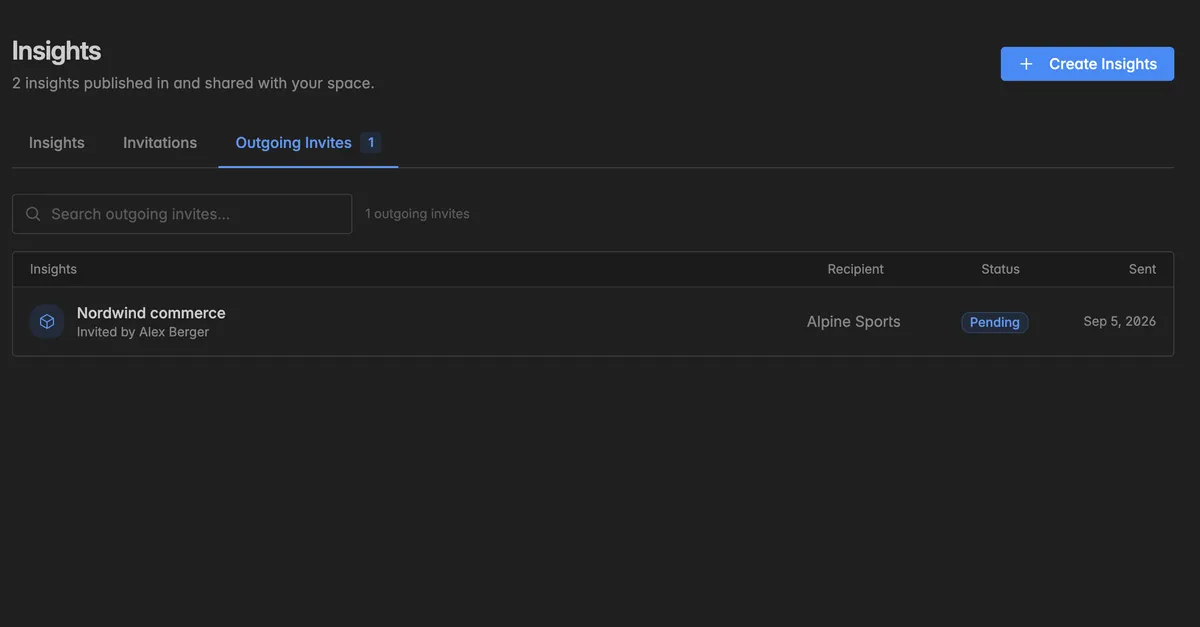
Outgoing Invites: Shares you sent to other spaces, with the recipient, the status Pending or Accepted, and the date.
Note: Pending invitations also appear on the Home page under Awaiting you, where an admin can accept or decline them in one click. See Home page.
What do I see when I open an Insight?
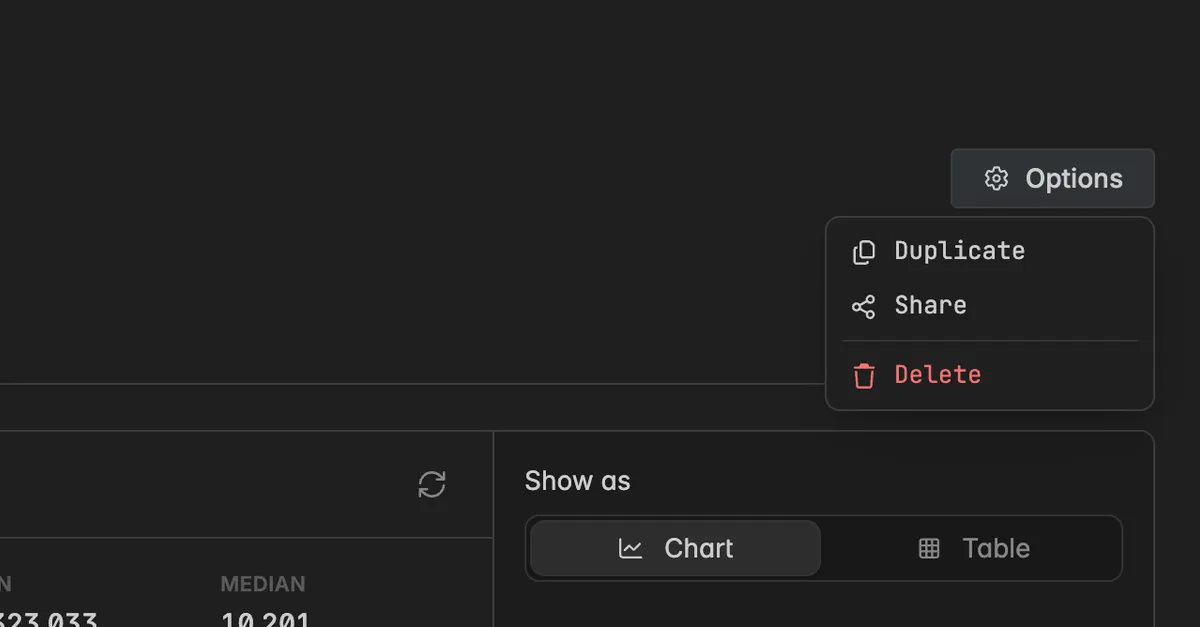
The header shows the name, the badges, the tag, and the creation date. Below it are three tabs: Insights, Sharing, and Overview. Options at the top right holds Duplicate, Share, and Delete.
Insights tab: Explore a metric
This tab lists every metric of the Insight under Metrics and lets you look at one without building a widget.
Click a metric on the left, for example Sessions. Hover over the
iicon next to it to read its description.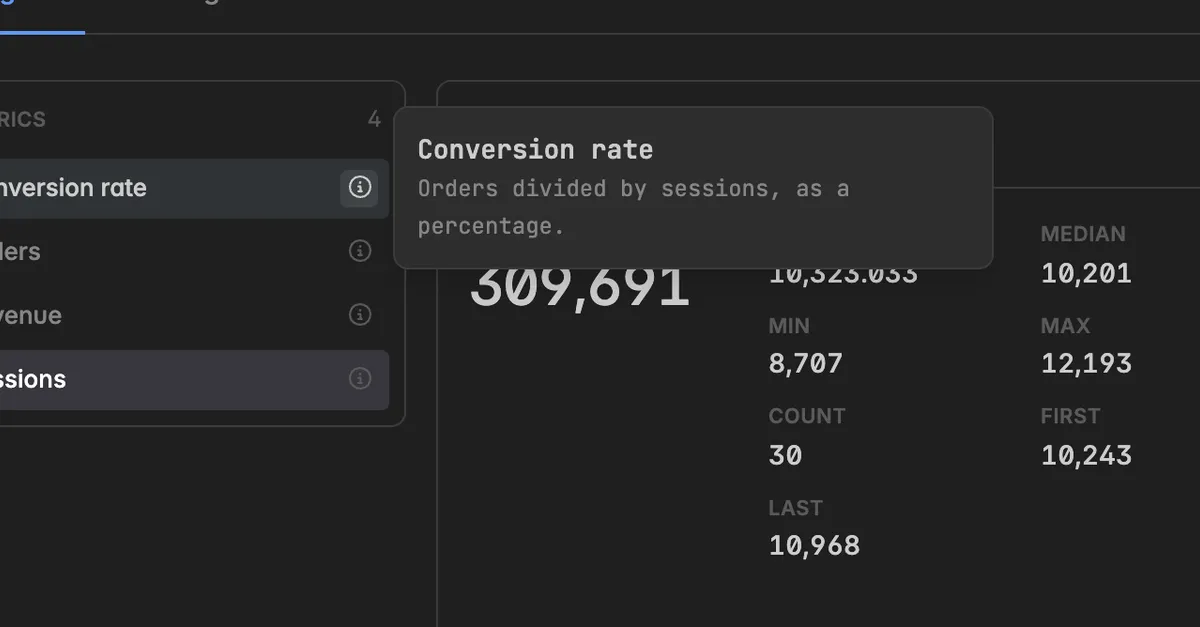
The panel in the middle shows the headline figures for the period, Sum, Mean, Median, Min, Max, Count, First, and Last, and a chart of the metric over time.
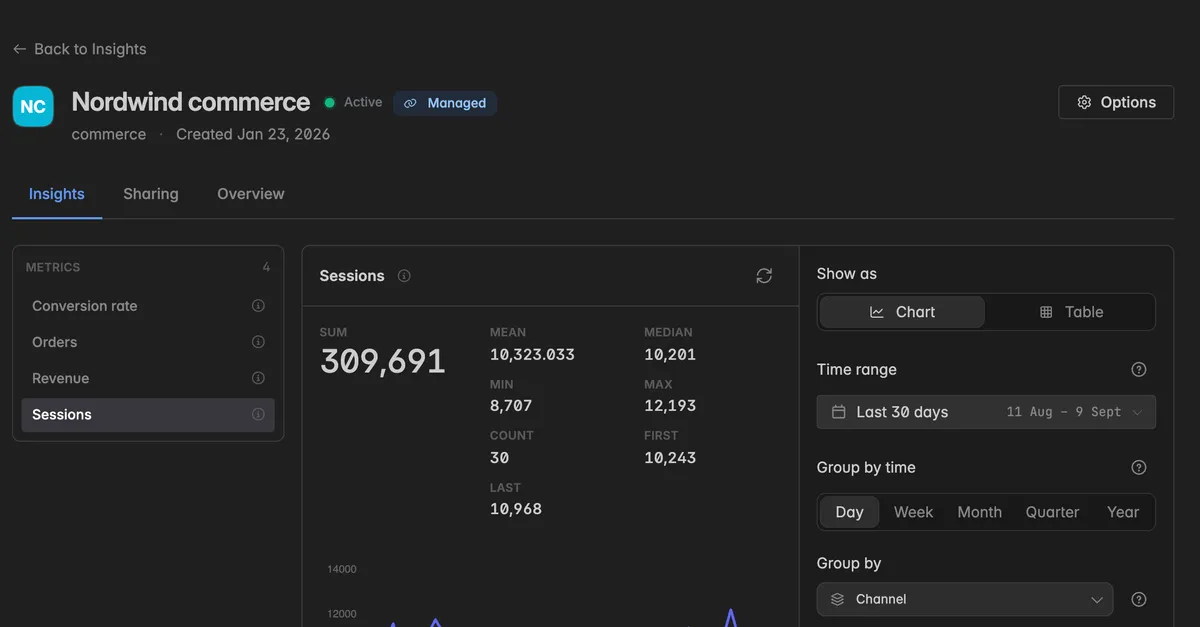
Use the settings on the right to change what you look at. They work exactly like their counterparts in the widget editor:
Show as: Chart or Table.
Time range: The period the numbers cover.
Group by time: Day, Week, Month, Quarter, or Year.
Group by: Split the metric by a dimension, for example one line per channel.
Search in time by: Which date on each record decides the period it counts in.
Chart type: Line or Bars.
Filters at the bottom of the panel: Keep only the rows that match, with All match or Any match and Add condition.
Nothing you set here is saved. It is a scratchpad to understand a metric before you put it on a dashboard. See Grouping and perspective for what the settings mean.
Overview tab: Name, image, and what the Insight is built on
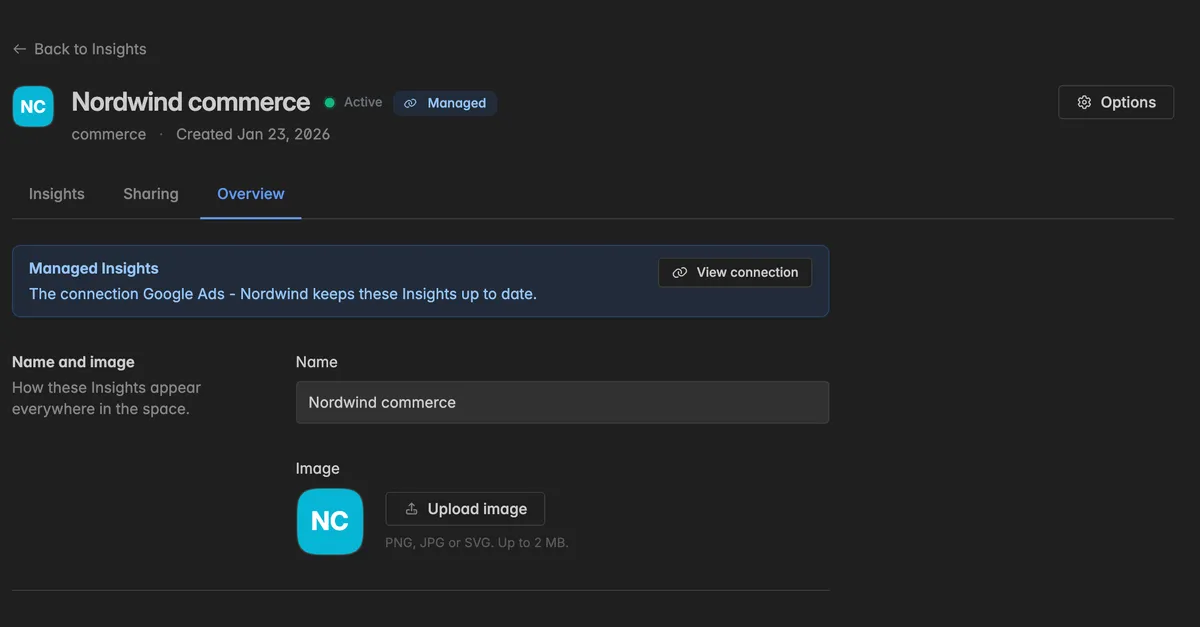
Managed Insights: For a Managed Insight, a banner names the connection that keeps it up to date. Click View connection to open it under
Connections.Name and image: The Name is how the Insight is called everywhere in the space. Click Upload image to add a logo, PNG, JPG, or SVG up to 2 MB.
Metrics: The KPI collection the Insight is built on. It decides which metrics and dimensions the Insight offers.
Source: The Source connection whose data feeds the metrics. Optional, some KPI collections do not read from a connection.
Advanced: Arguments, key and value pairs some metric definitions ask for. Most Insights need none.
Click Save at the bottom after a change. The page reminds you with You have unsaved changes until you do.
Sharing tab
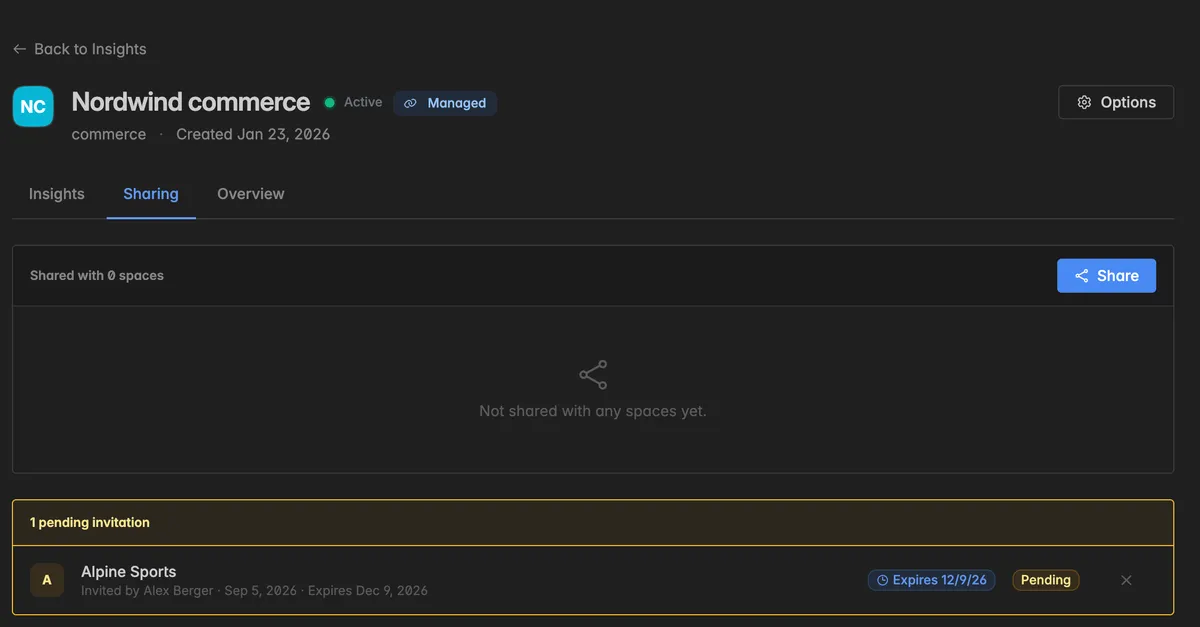
Lists the spaces the Insight is shared with, pending invitations, and a Share button. See Share Insights.
How is an Insight created?
There are three ways an Insight gets into your space.
Managed, from a connection
When you connect an integration under Data sources → Marketplace, Indicate creates the matching Managed Insight for you as soon as the connection delivers data. You do not build it by hand. See Add a data source.
Custom, from a KPI collection
Under
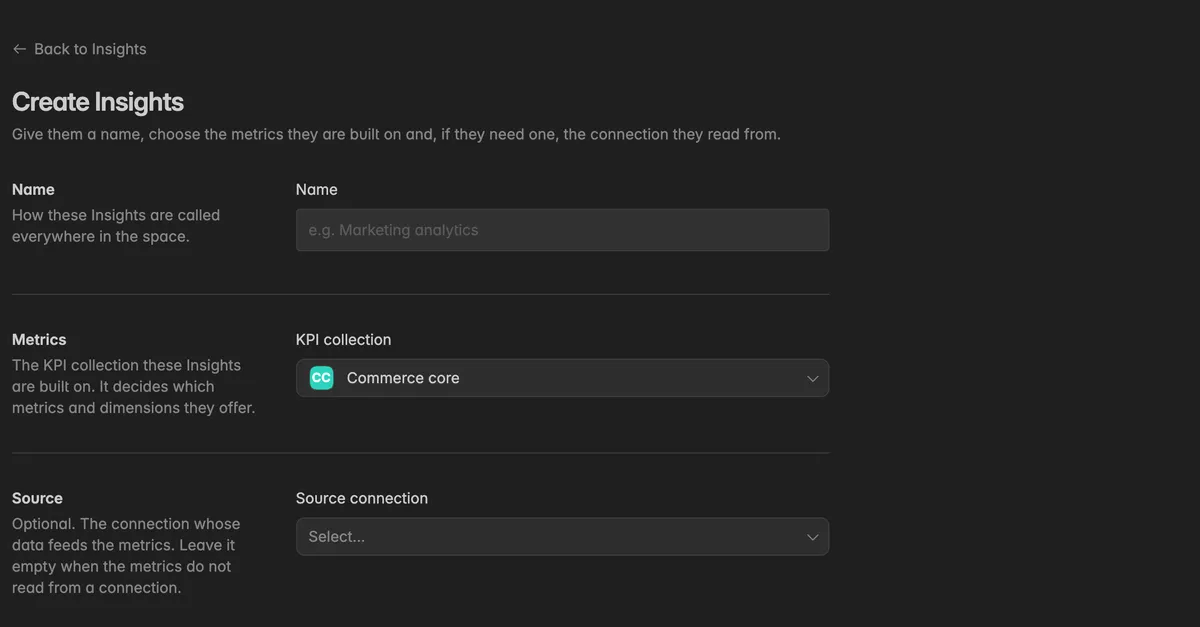
Insights, click Create Insights at the top right. This needs at least the User role.Enter a Name, for example Marketing analytics.
Under Metrics, pick the KPI collection the Insight is built on. If the list is empty, click Go to KPI collections and create or import one first.
Under Source, pick the Source connection that feeds the metrics, or leave it empty.
Under Advanced, add Arguments only if a metric definition asks for them.
Click Create Insights.
The full walkthrough, including how to build the KPI collection, is in Publish a KPI collection as an Insight.
Shared, from another space
Another space shares its Insight with yours and an admin accepts the invitation. The Insight then appears in your list with the badges Shared with you and Read-only. See Share Insights.
How do I rename an Insight or add a logo?
Open the Insight and click the Overview tab.
Change the Name, or click Upload image and pick a file.
Click Save.
The new name and image show up in the list, in the widget editor, and in every widget header that reads from the Insight.
How do I duplicate an Insight?
A duplicate is a second Insight on the same KPI collection and connection, for example to give one team its own name and arguments.
Open the Insight, click Options, and select Duplicate.
In the dialog Duplicate Insights, enter a Name of the copy or leave it empty for Copy of [name].
Click Duplicate.
What can I do with an Insight another space shared with me?
A shared Insight opens like your own, with a banner Shared with your space by [space] and, if the owner set one, the date on which access ends.
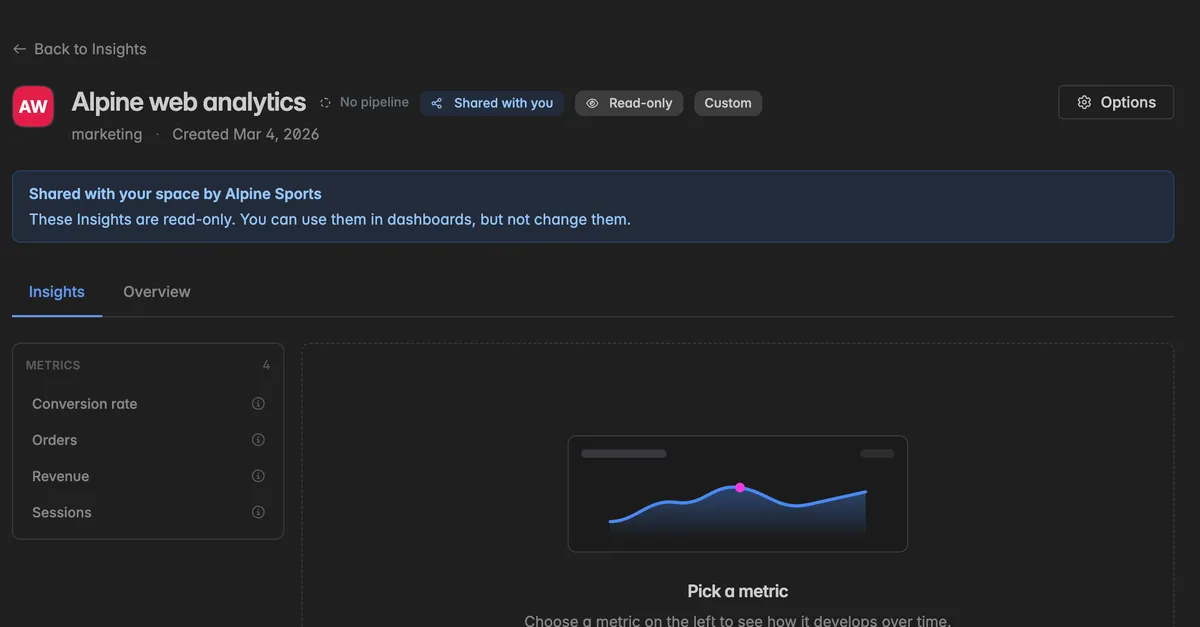
You can explore its metrics on the Insights tab and use them in widgets, the chat with Resi, and AI assistants.
You cannot change it. The Overview tab is read-only, there is no Sharing tab, and you cannot share it on to a third space.
You cannot open the connection or the raw data behind it. Those stay in the space that owns the Insight.
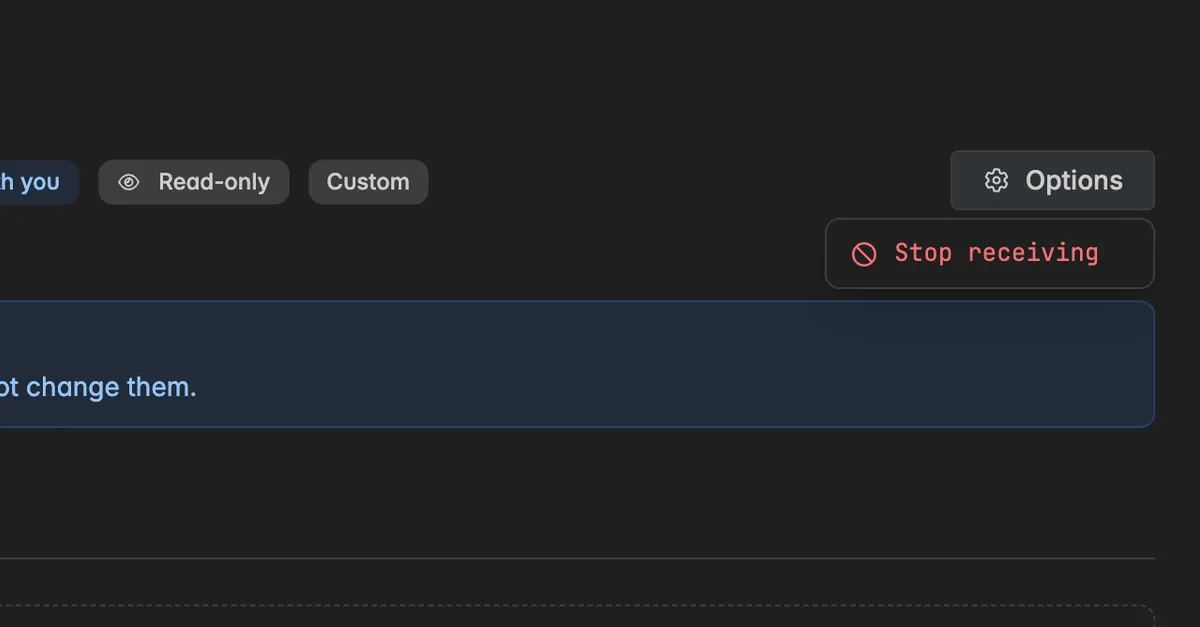
Options offers Stop receiving. It removes the Insight from your space, and every widget built on it stops working. You need a new invitation to get it back.
How do I delete an Insight?
Deleting removes the Insight permanently, and every widget built on it stops working. The connection and the data already in the warehouse stay untouched. It needs the Admin role.
Open the Insight, click Options, and select Delete.
In the dialog Delete Insights, read the warnings, type the name to confirm, and click Delete.
See Delete & Add Insights for what exactly is affected and how to build the Insight again.
Troubleshooting
An Insight I expected is not in the list
Check the filters. Owned hides shared Insights, Shared with me hides your own. Click All in both groups.
If another space shared it, an admin has to accept the invitation first. Open the Invitations tab, or the Home page under Awaiting you.
I connected a system but no Insight appeared
The Managed Insight appears once the connection has delivered data, which can take up to 72 hours depending on the integration. Check the connection under
Connections. If the Insight was deleted, build it again, see Delete & Add Insights.
The Insight is listed under Attention
The connection behind it stopped delivering. Open the Insight, click View connection on the Overview tab, and reconnect or review it. Widgets keep showing the last synced data in the meantime.
The metric panel says Could not load this metric
For a Custom Insight, the metric definition fails or no source connection is set. Set the connection on the Overview tab, or open the KPI collection in
KPI Studioand check the definition. See Build a custom KPI in KPI Studio.
The Insight has no metrics
The KPI collection behind it is empty. Open it under
KPI Studioand add a KPI. Metrics appear in the Insight as soon as the collection has some.
I cannot see Create Insights, Share, or Delete
Creating needs at least the User role, deleting the Admin role. On a shared Insight there is no Share or Delete, only Stop receiving.
The Insight says its data was retired
The KPI collection or the integration it was built on has been retired and no longer returns data. Move your widgets to a replacement Insight, see Manage widget data sources & Metrics.