
Edit widget calendar
Set the time range saved on a widget, pick presets or custom dates, and put a temporary range over one widget or the whole dashboard for your view only.
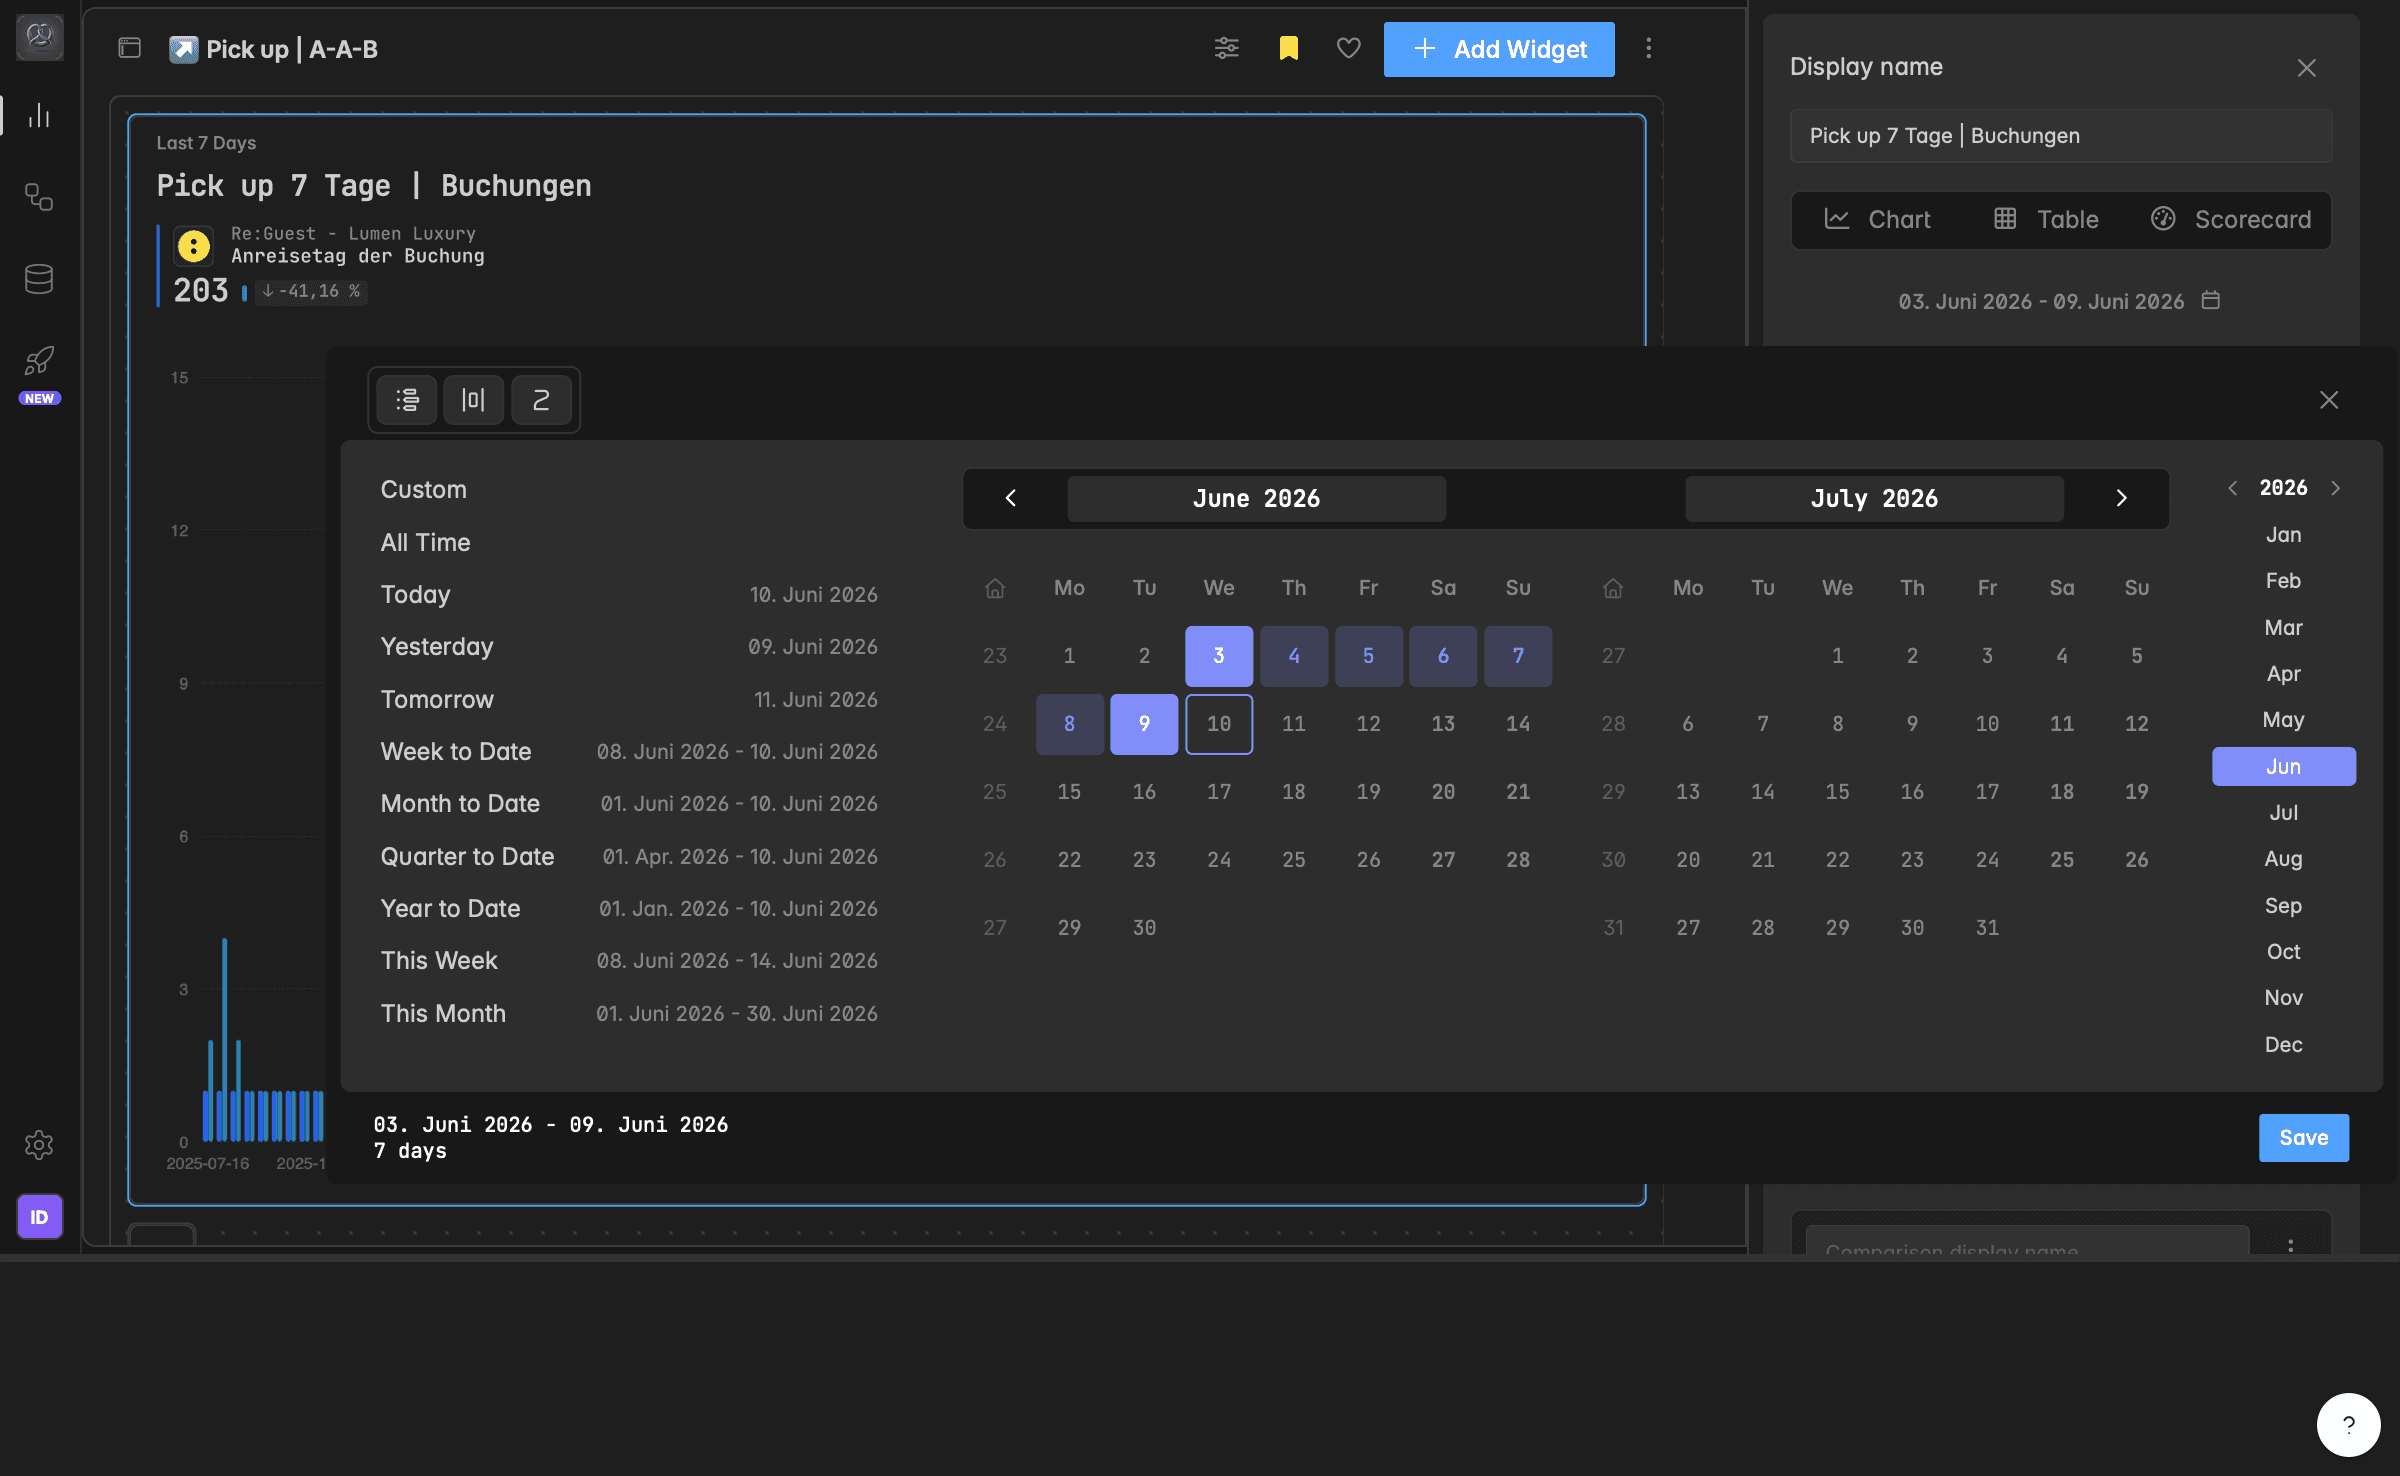
What does the time range control?
Every widget reads one time range, for example Last 30 days or Year to date. It decides which records the widget shows and is saved with the widget, so everyone who opens the dashboard sees the same period.
On top of that saved range there are two temporary layers that only change what you see:
A dashboard time range that puts one period over every widget on the dashboard, set with the Overrides switch in the toolbar.
A widget time range that you pick on a single widget card, for example to check last year on one chart without touching the others.
Both layers are stored in your browser, not on the widget. Other members keep seeing the saved range.
How do I set the time range of a widget?
This changes the range that is saved with the widget. It needs at least the User role.
Open the dashboard and click the name of the widget. The widget editor opens on the right.
Under Time range, click the field that shows the current range, for example Last 60 days.
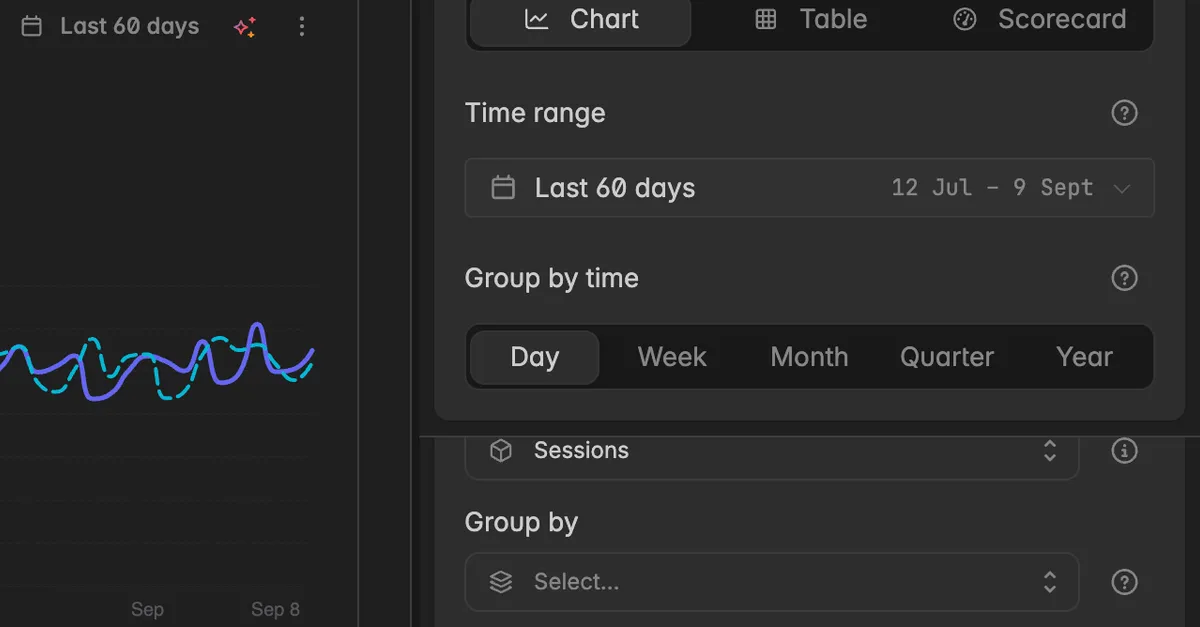
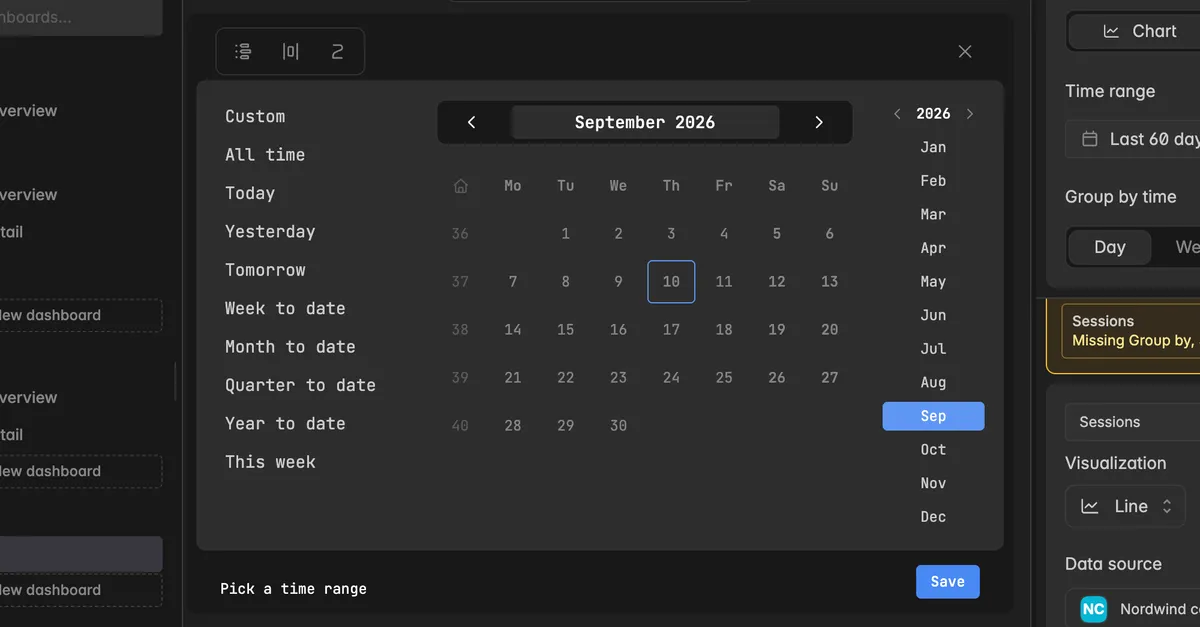
Pick a preset from the list on the left, for example Month to date, or click Custom and select a start and an end day in the calendar.
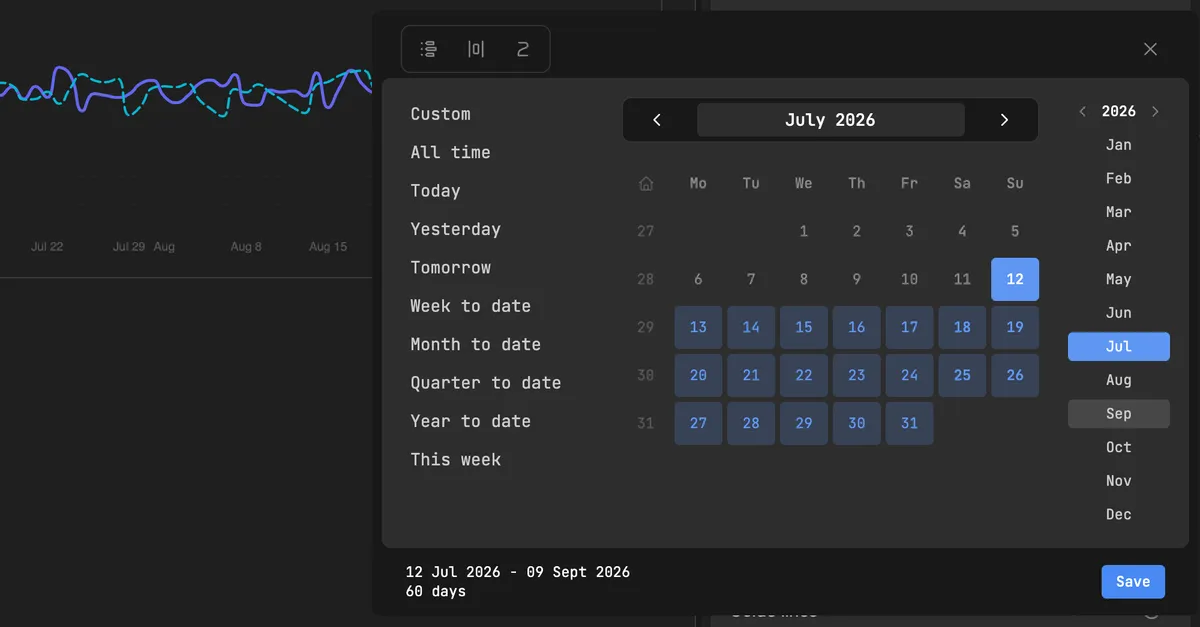
Check the line at the bottom of the picker. It shows the exact dates and the number of days.
Click Save.
The widget updates right away. Changes in the editor save on their own.
Working with the calendar
Use the arrows next to the month name to move month by month, and the arrows next to the year to move year by year. The list of months on the right jumps to a month directly.
Click the month name to select the whole month. Click the year to select the whole year.
Click the house icon to jump back to today.
The three icons at the top left toggle the preset list, show the exact dates behind each preset, and show two months side by side.
Reset puts the picker back to the range it opened with.
What presets are available?
Presets are rolling windows. Last 7 days always means the seven days up to today, whenever the dashboard is opened.
| Preset | What it shows |
|---|---|
| Custom | Any start and end day you pick in the calendar. |
| All time | Everything the source has. The field then shows a dash instead of dates. |
| Today, Yesterday, Tomorrow | That single day. |
| Week to date, Month to date, Quarter to date, Year to date | From the first day of the current week, month, quarter, or year up to today. |
| This week, This month, This quarter, This year | The full current period, including the days still to come. |
| Last 7, 14, 28, 30, 60, 90, 365 days | That many days, ending today. |
| Last week, Last month, Last quarter, Last year | The previous full period. |
| Next 7, 14, 28, 30, 60, 90, 365 days | That many days, starting today. For forecasts and occupancy. |
| Next week, Next month, Next quarter, Next year | The coming full period. |
How do I change the range on one widget just for me?
Every widget card shows its time range at the top right, for example Last 60 days. Hover over it and the tooltip tells you where the range comes from: saved on this widget, from the dashboard, or your view only.
On the dashboard, click the time range on the widget card.
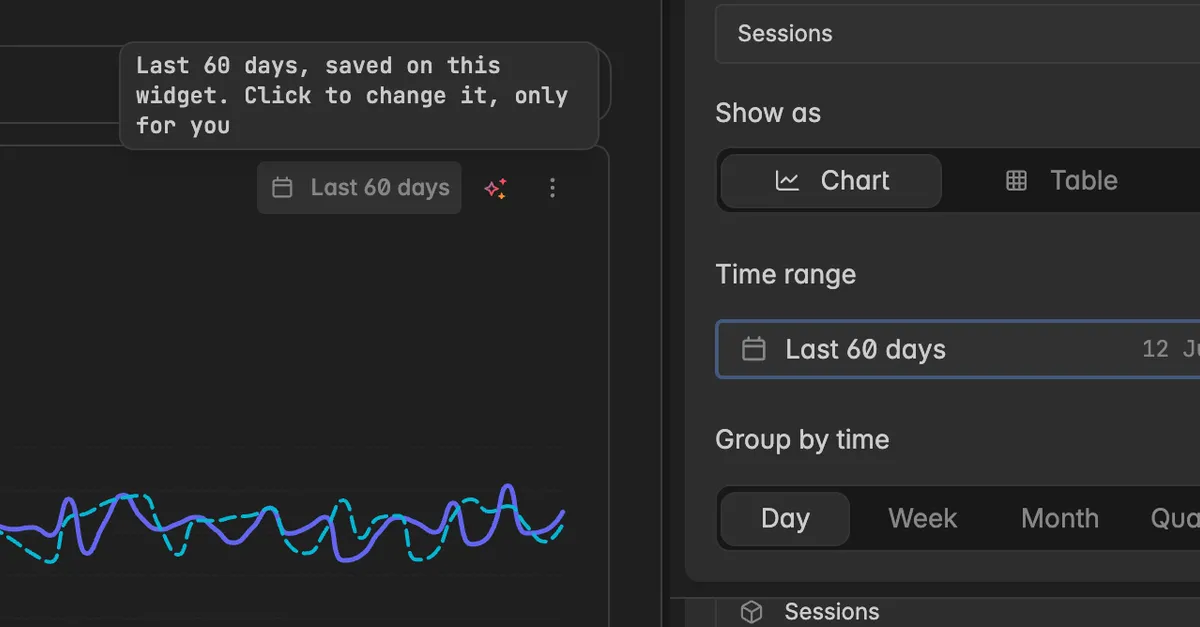
Pick a preset from the menu, or click Custom range… to open the calendar.
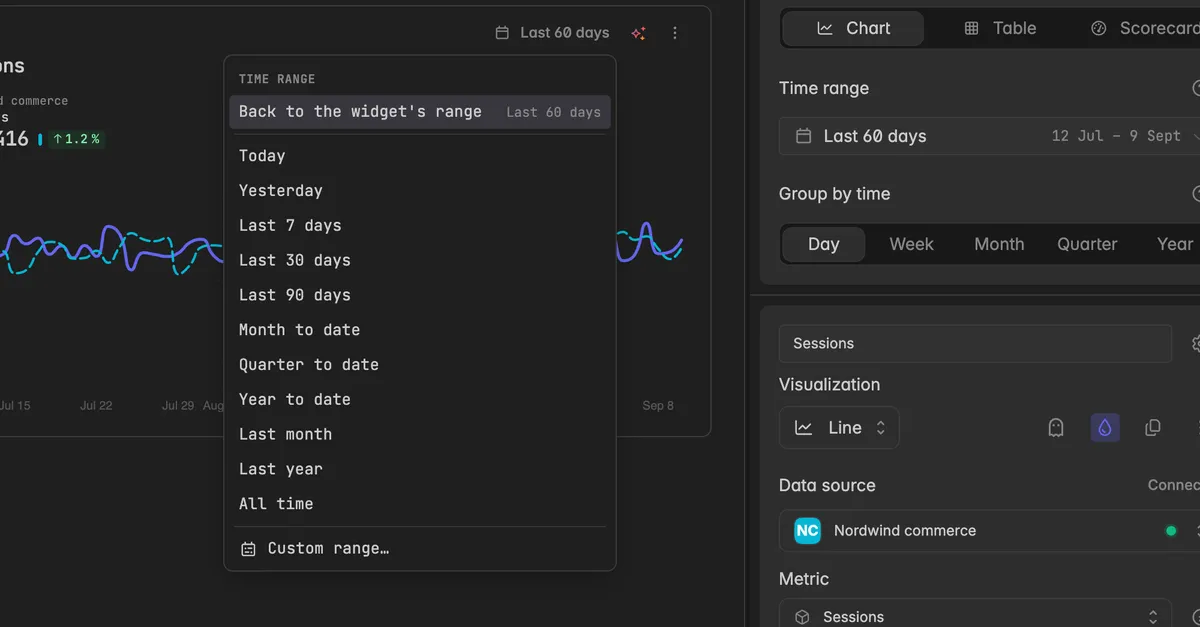
The widget reloads with your range. Nothing is saved on the widget. Everyone else keeps seeing the saved range.
To go back, open the menu again and click Back to the widget's range. If the dashboard has a time range switched on, the entry reads Back to the dashboard's range instead.
Note: Your pick is remembered in this browser, also after a reload. On another device the widget shows the saved range again. This works with every role, including Reader.
How do I set one time range for the whole dashboard?
Use this to look at every widget for the same period, for example last month, without editing each widget.
Open the dashboard and click the Overrides icon at the top right of the toolbar. The tooltip reads Set one time range for every widget on this dashboard.
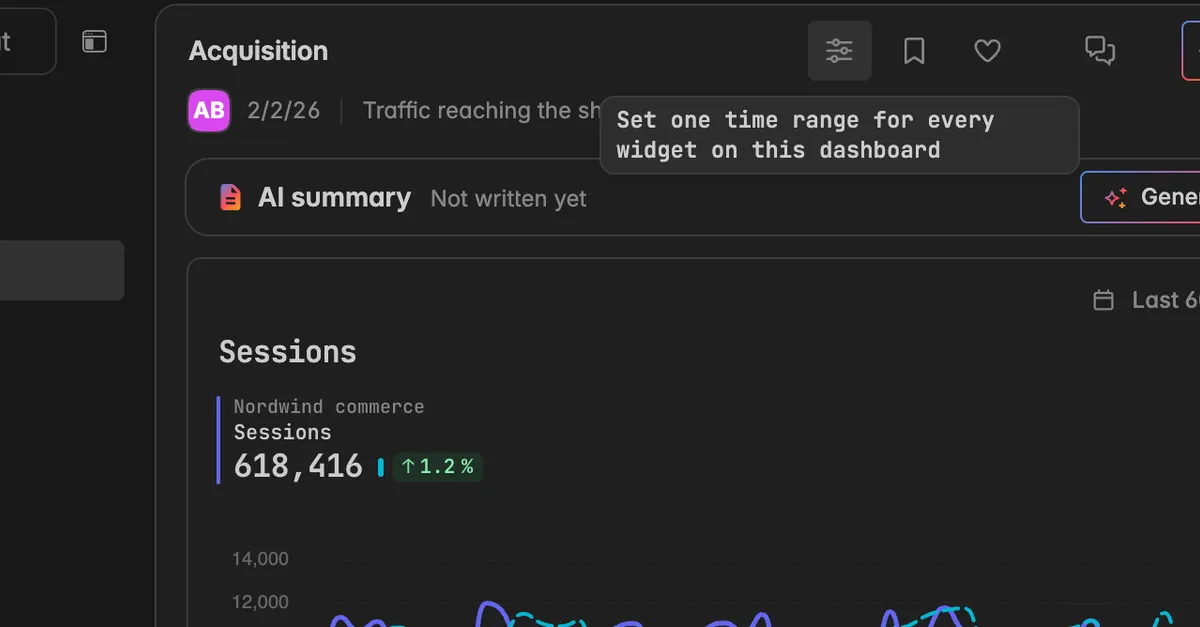
The switch turns on and a chip Pick a time range appears below the toolbar.
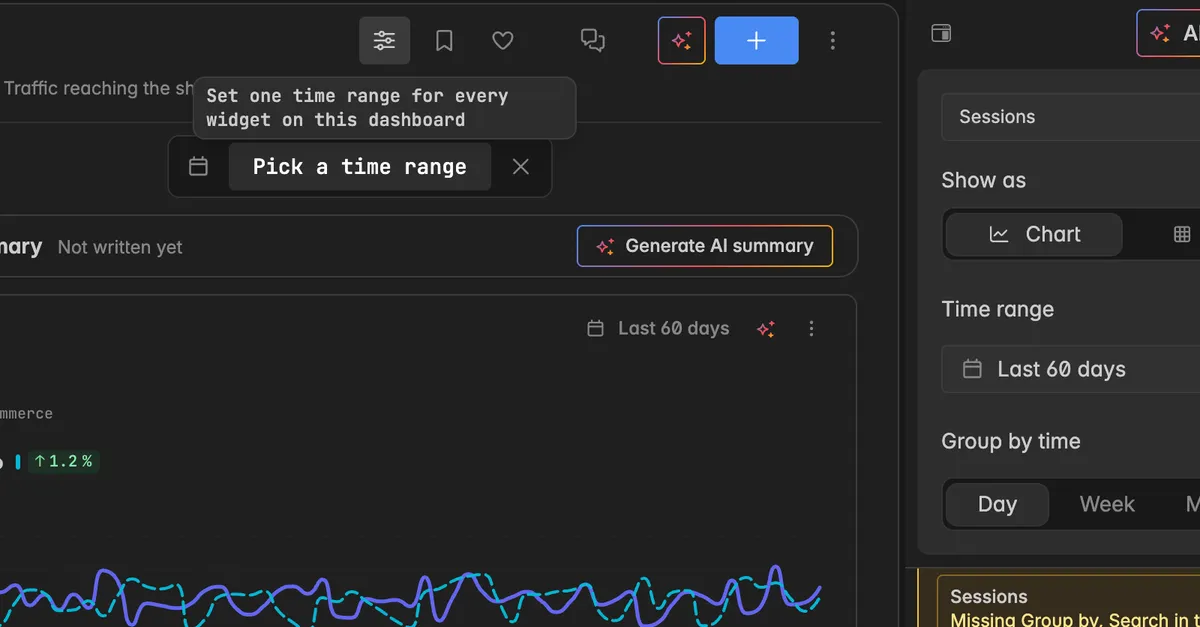
Click the chip and choose a preset or a custom range, then click Save.
Every widget now reads that range, and the range on each widget card tells you that it comes from the dashboard. Click the x on the chip to clear the range, or click the Overrides icon again to turn the layer off. The saved ranges of the widgets are never changed.
Note: The dashboard time range is stored in your browser and only affects your view. The home dashboard on the Home page has the same switch, see Home page.
Which range wins?
When more than one layer is set, the widget uses the most specific one:
Your pick on the widget card. In the editor this range carries the note Your view only, not saved with the widget.
The dashboard time range. In the editor it carries the note Set on the dashboard, for your view only, with a Turn off link. If you also picked a range on the widget card, the dashboard range is marked overruled by your pick above.
The range saved on the widget.
While one of the temporary layers applies, the saved Time range field in the editor is locked and shows The saved setting is locked while a temporary one applies. Click Reset or Turn off next to the note to unlock it.
Troubleshooting
The widget shows No data in this range
The range falls outside the data the source has. Switch to All time to see whether there is data at all, then narrow down again.
Sources that only hold future data, for example forecasts or occupancy, need a Next … preset.
A source connected today has no history yet. Depending on the integration it can take up to 72 hours until data arrives.
I cannot edit the Time range field in the editor
- A temporary range is applied for your view, either on the widget card or through the dashboard Overrides. Click Reset or Turn off next to the note below the field.
My colleague sees a different period than I do
- Ranges picked on a widget card or through Overrides only apply to your own browser. To change what everyone sees, set the range in the widget editor and click Save.
The range I picked on a widget is gone
- Widget and dashboard ranges live in the browser. After clearing site data, in a private window, or on another device the widgets show their saved range again.
Was this helpful?