
Guide lines
Draw a guide line on a series, such as its mean, a target, or a custom level and extent, and use it as the reference for a comparison.
What is a guide line?
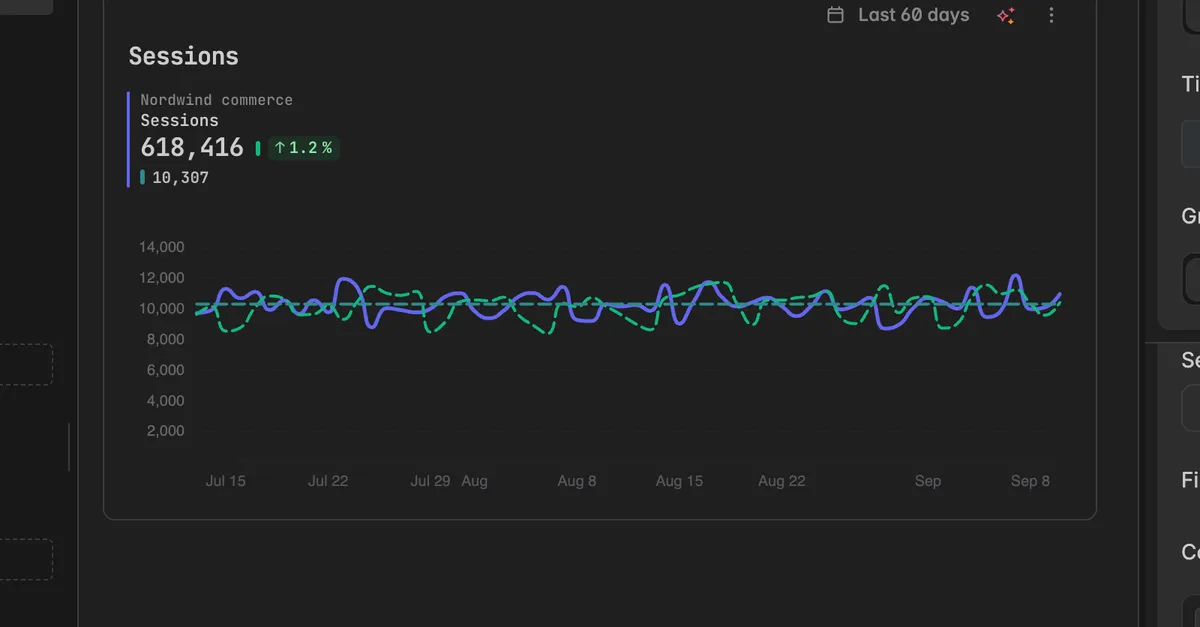
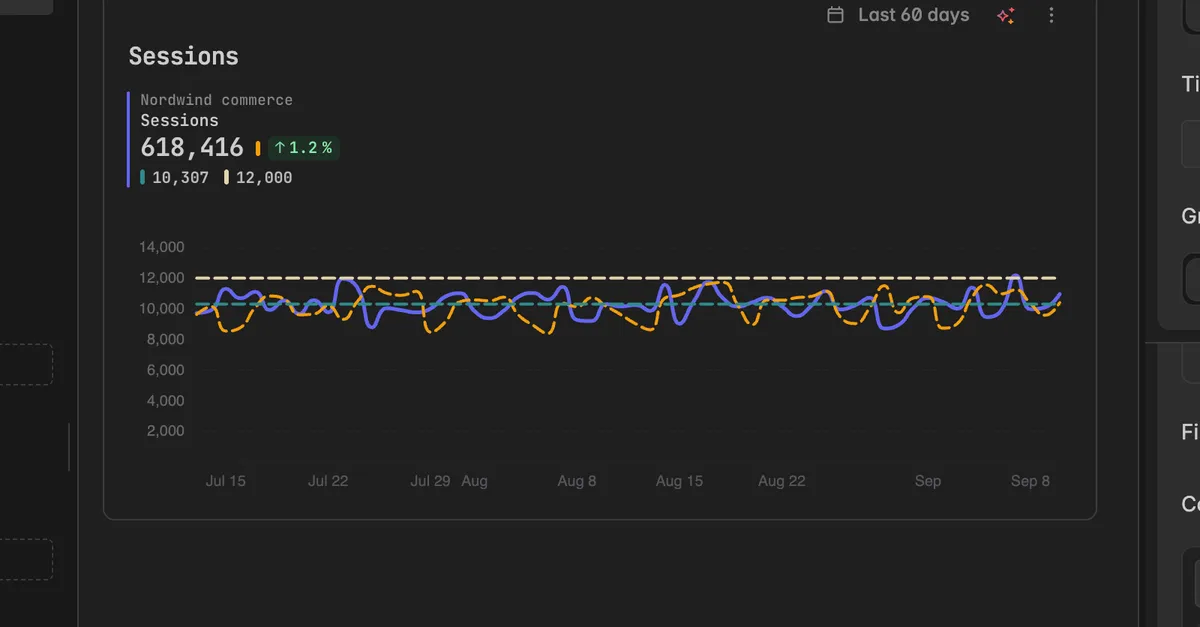
A guide line is an extra line drawn on a series to read it against: its average, its highest value, zero, or a target you set. It does not change the data, it adds context. On a chart it is drawn as a dashed line, on a scorecard its value is listed under the headline number.
Guide lines are set per series in the widget editor. A series can have several, for example a Mean line and a Target line. Each one has its own name and color and can be hidden without deleting it. A guide line can also serve as the reference for a comparison, so the widget judges the series against it, see Comparisons.
Note: Guide lines were called reference lines in earlier versions. The advanced settings still list them under References.
How do I add a guide line?
Editing needs at least the User role.
Open the dashboard and click the name of the widget. The widget editor opens on the right.
Scroll to the series and click Add next to Guide lines.
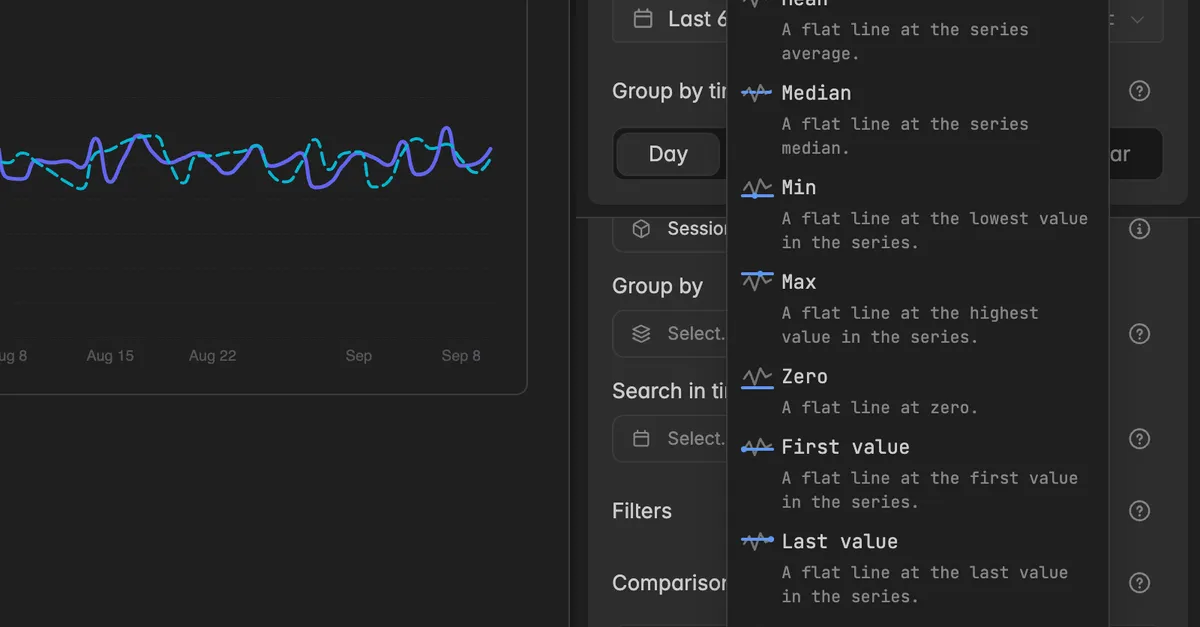
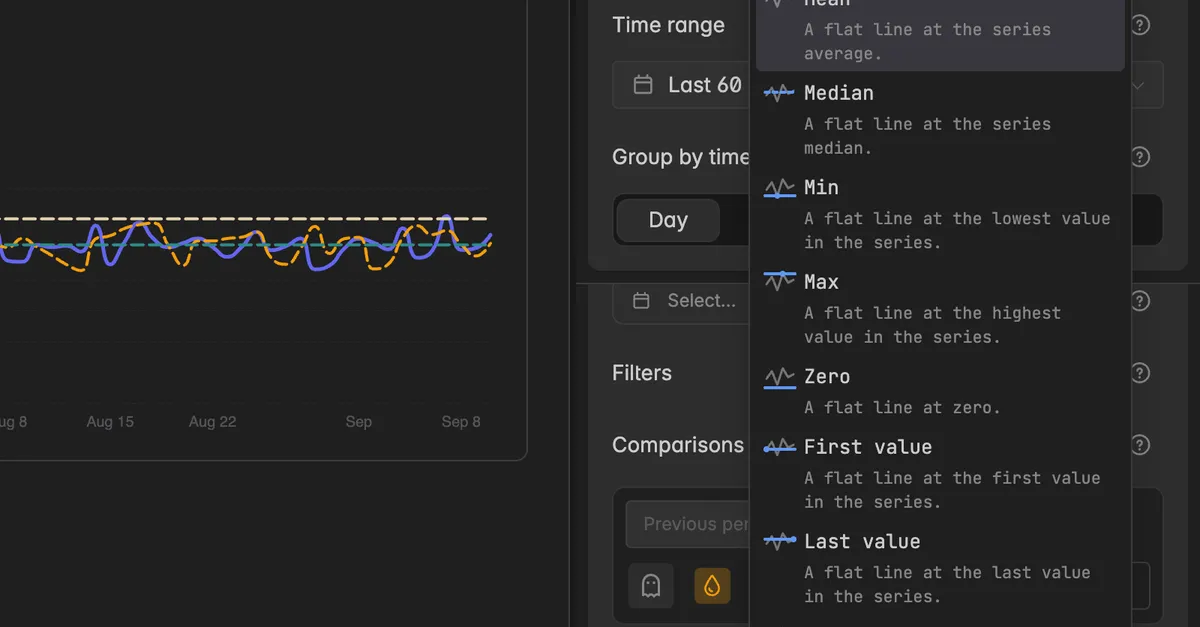
Pick a preset:
Mean, Median, Min, Max, Zero, First value, Last value: a flat line at that value of the series.
Target: a flat line at a value you set.
Start to end: a straight line from the first value to the last.
Custom…: your own levels, extent, and slope, shaped in the advanced settings.
The guide line appears as a row under Guide lines and is drawn on the widget right away.
On the board, the widget shows the line and lists its value in the header.
Setting a target
Click Add next to Guide lines and pick Target.
Type the value in the field at the end of the row, for example
12000.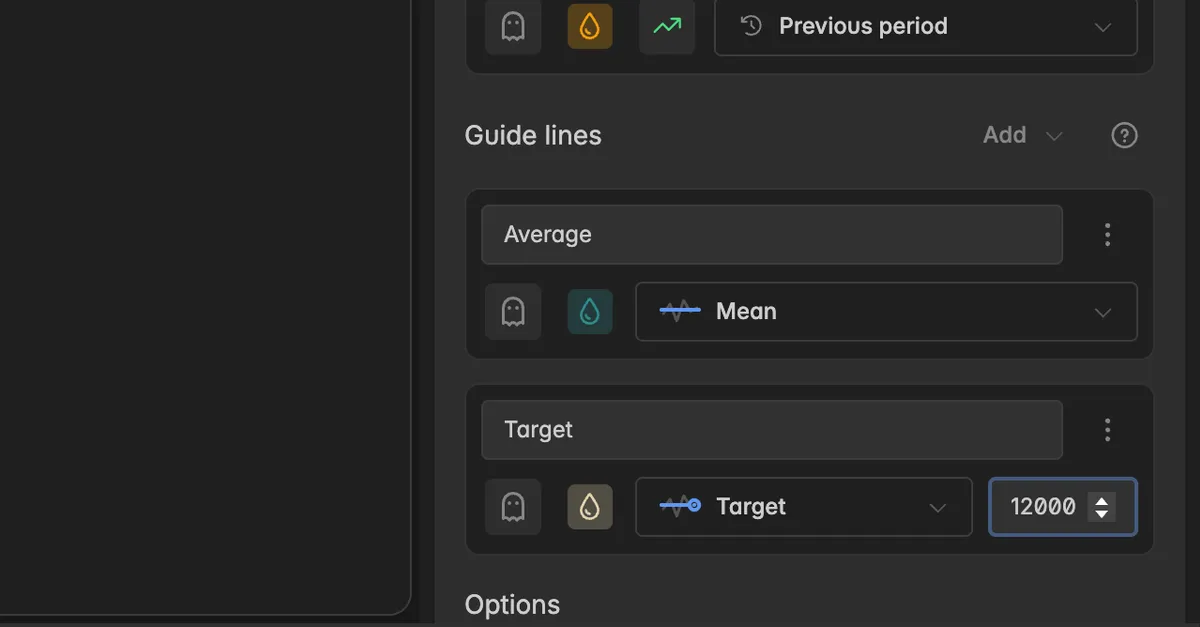
The target is drawn as a flat line at that value.
What is on a guide line row?
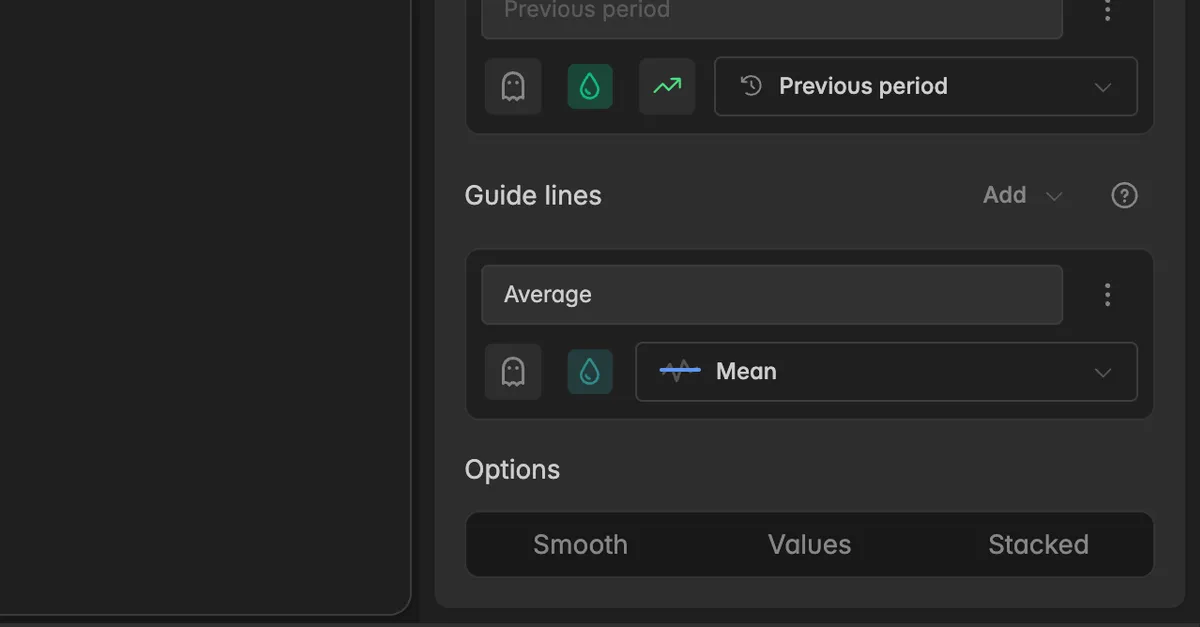
Guide line name: the label shown in the legend and the header. It is filled with the preset name, for example Average, and can be changed.
Ghost icon: hides the guide line without deleting it. Click again to show it.
Color drop: the color of the line.
Guide line: the field that names the preset, for example Mean. Click it to switch to another preset or to Custom….
Value: only for Target, the value of the line.
⋮Guide line actions: Advanced settings and Delete.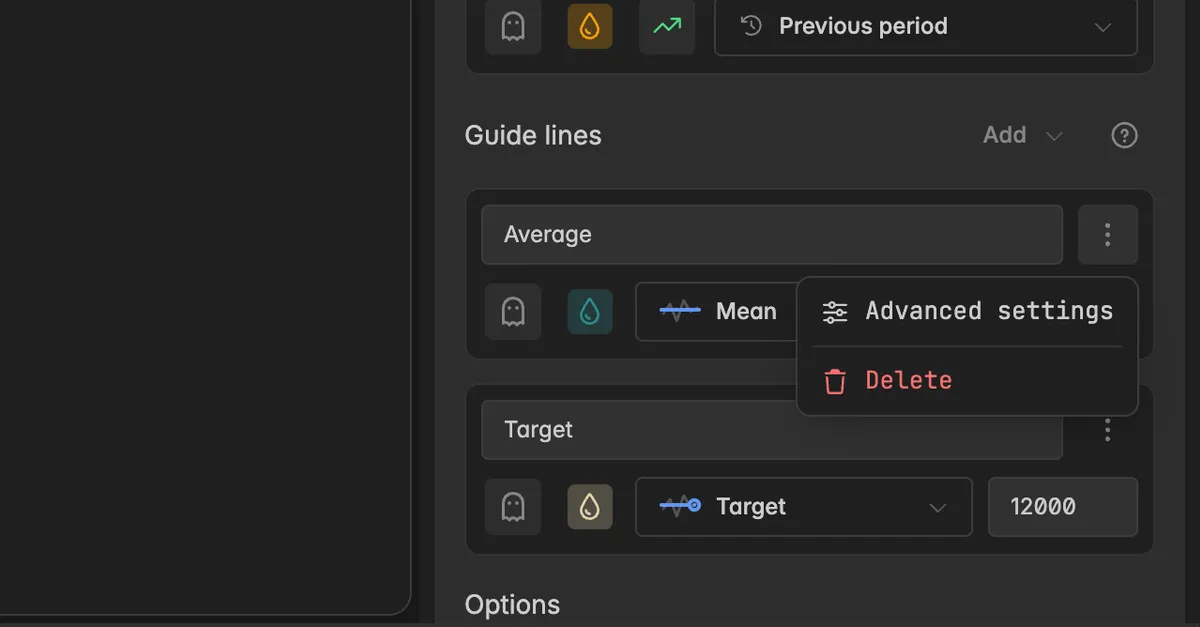
How do I shape a custom guide line?
Use the advanced settings for anything the presets do not cover: a line at a percentile, a line that runs only over part of the chart, or a sloped line.
Click
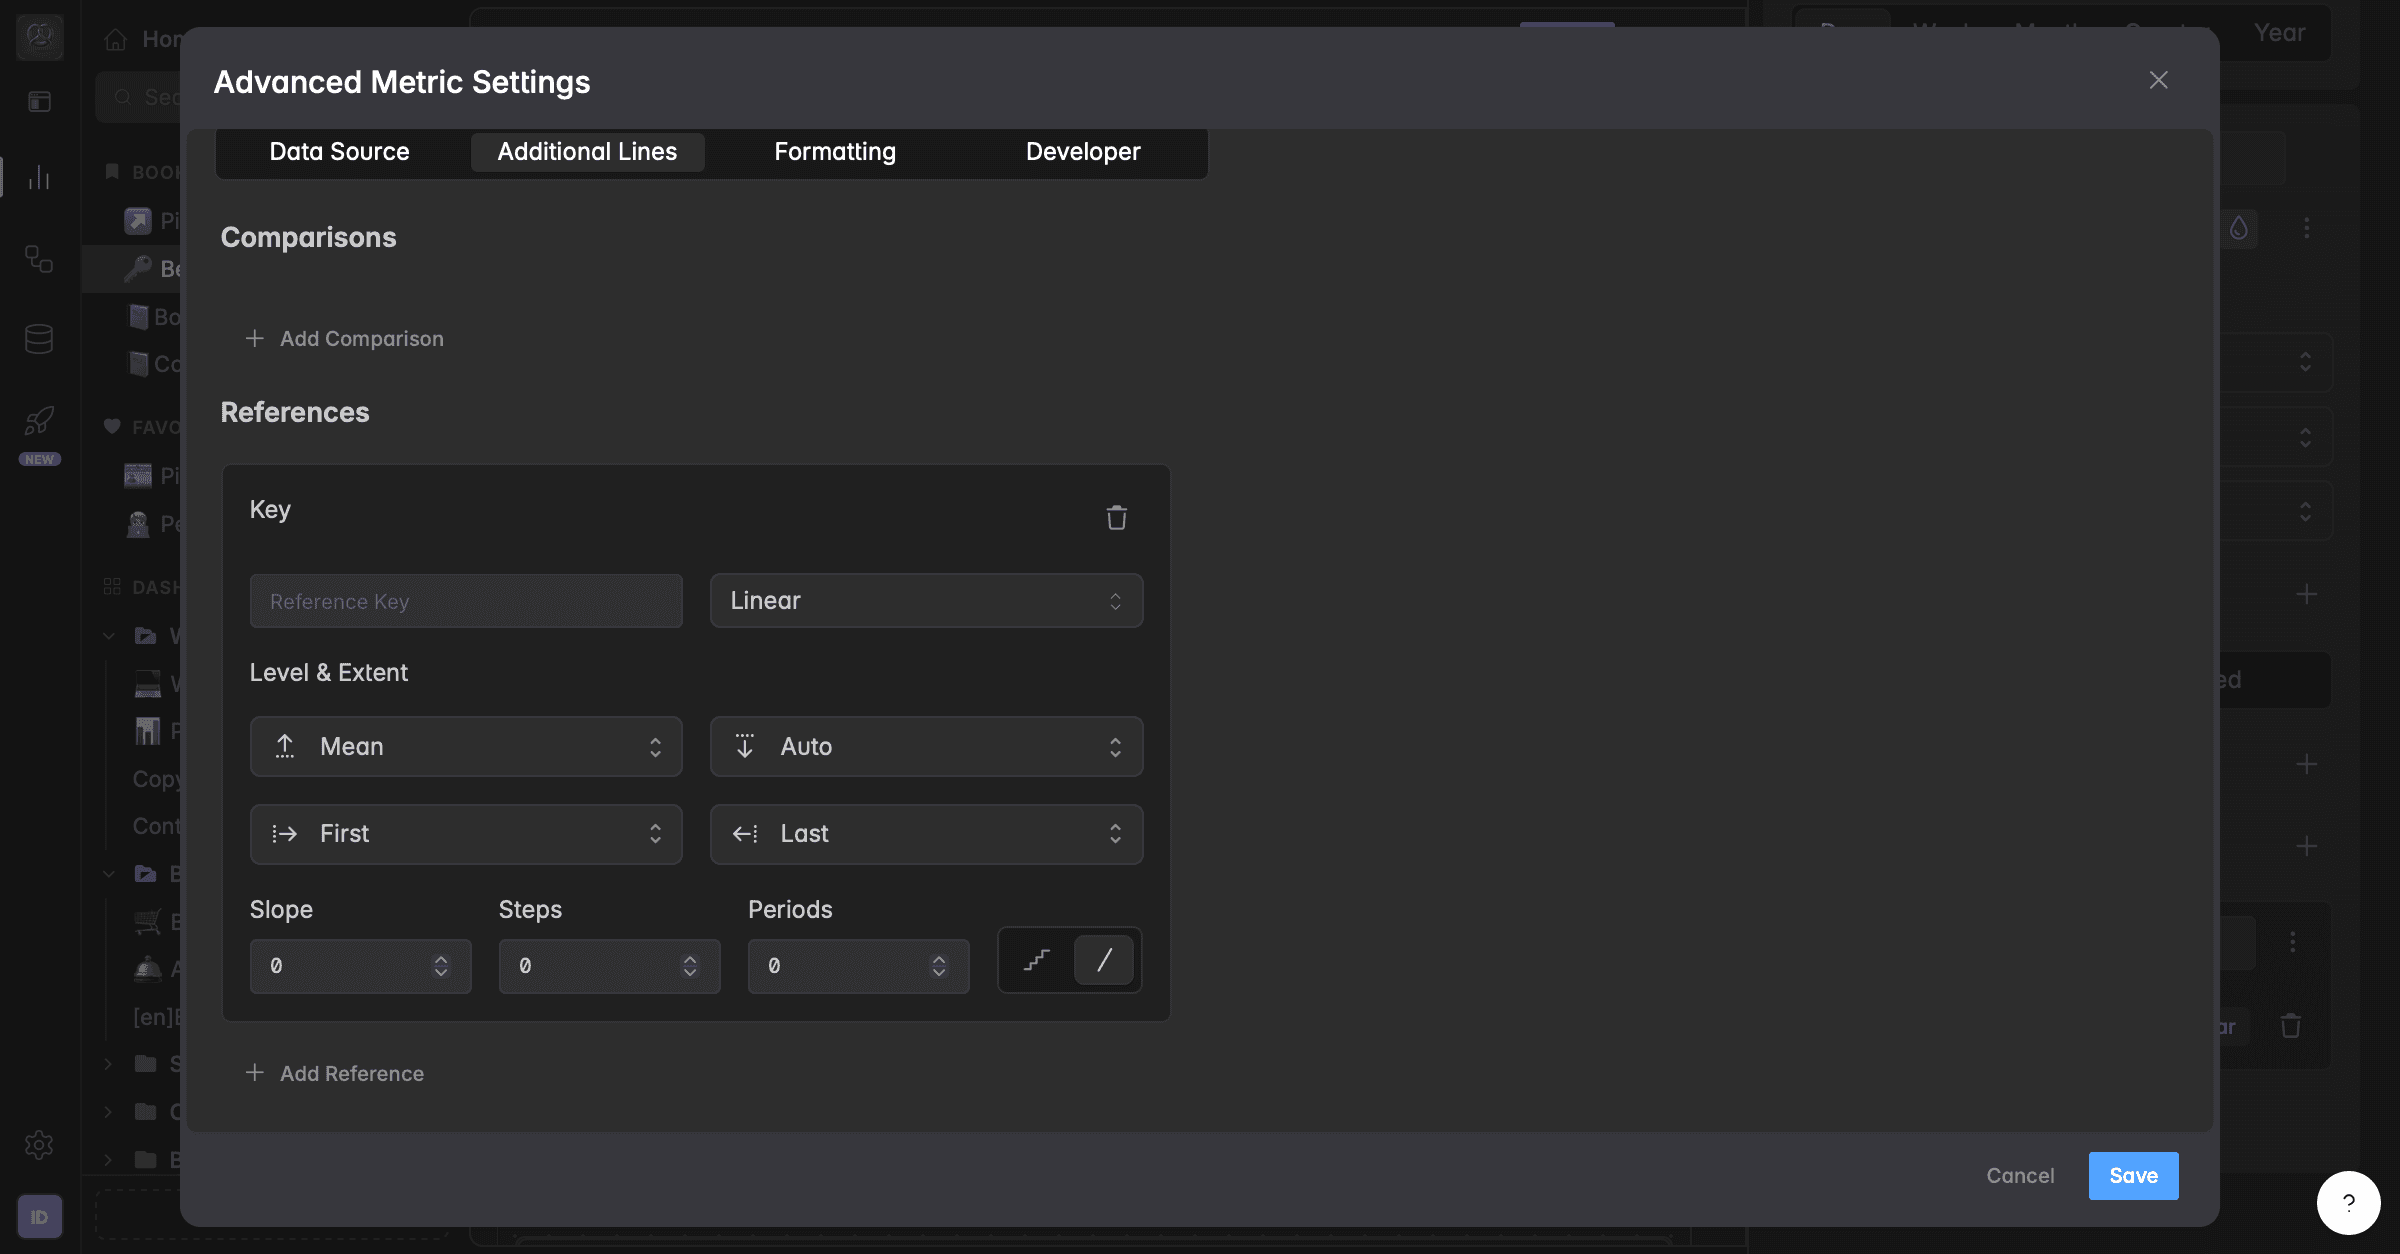
⋮on the guide line row and select Advanced settings, or pick Custom… when adding. The dialog Advanced settings opens on the Additional lines tab, section References.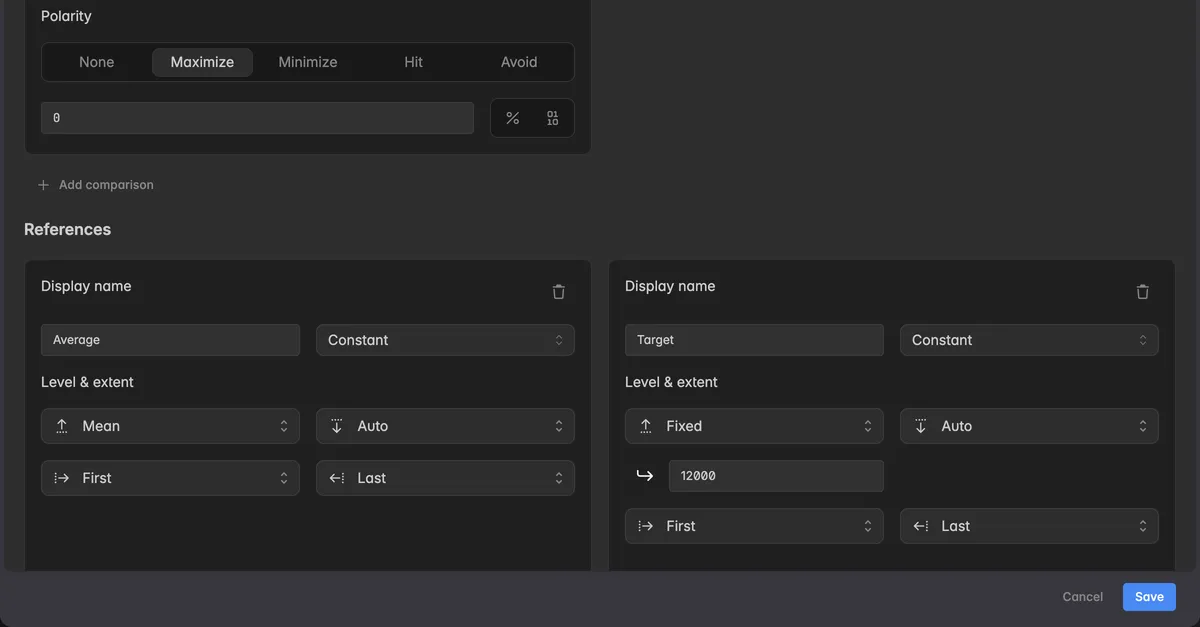
Set the fields of the reference:
Display name: the label of the line.
Constant or Linear: a flat line, or a line that connects a start and an end point.
Level & extent: two rows. The first row sets the level, where the line sits on the value axis, and the second row the extent, where it starts and ends on the time axis. For a Linear line each has a start and an end value.
Click Add reference at the bottom of the section to add another one, or the trash icon to remove one.
Click Save. The row in the editor now reads Custom with a short description of the line.
Level options
The level sets the value of the line:
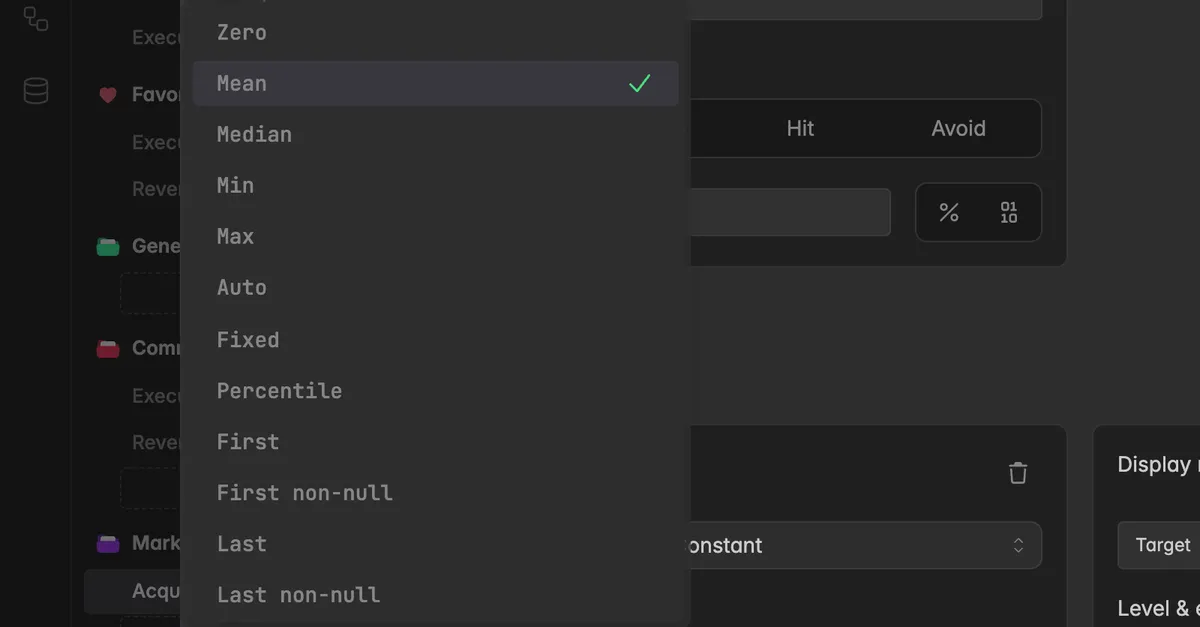
| Level | The line sits at |
|---|---|
| Zero | the value 0. |
| Mean | the average of the series. |
| Median | the middle value of the series. |
| Min, Max | the lowest or highest value of the series. |
| Auto | a value Indicate picks from the chart. |
| Fixed | a value you type in. |
| Percentile | a percentile you type in, for example 90. |
| First, Last | the first or last value of the series. |
| First non-null, Last non-null | the first or last value that is not empty. |
Extent options
The extent sets where the line starts and ends:
| Extent | The line runs |
|---|---|
| Auto | across the whole chart. |
| First, Last | from the first or to the last point. |
| Fixed | from or to a point you type in. |
| Offset | shifted by a number of periods you type in. |
Slope, Steps, and Periods
A Linear line has three more fields: Slope sets how steeply it rises or falls, Steps in how many increments it is calculated, and Periods shifts it forward or backward by a number of periods. Use them for a growth target that climbs over the year or for a line that lines up with a lagged plan.
How do I compare a series against a guide line?
Once a series has a guide line, it can serve as the reference for a comparison. The widget then shows how far the series is from the line and, with a direction set, whether that is good or bad.
Add the guide line as described above.
Click Add next to Comparisons and pick the guide line under Against a guide line. Or open the Compared with field of an existing comparison and pick it there.
Set the direction on the comparison row, for example On target for a target line. See Comparisons.
Troubleshooting
The guide line is not on the chart
It may be hidden. On the guide line row the ghost icon is highlighted. Click it to show the line.
A Target without a value draws nothing. Type the value in the field at the end of the row.
The line sits at the wrong height
- Check the Level in the advanced settings. Mean follows the data and moves when the time range changes, Fixed stays where you set it.
The comparison cannot find the guide line
- The comparison references guide lines of the same series only. Add the guide line on the series that carries the comparison, then pick it under Against a guide line.
The guide line disappeared after I changed the data source
- Levels like Mean or Max are calculated from the series. If the new source returns no data, there is nothing to calculate. Check the data source and the time range first.
Was this helpful?