
Manage widget data sources & Metrics
Change the Insight and metric behind a widget, split it by a dimension, add or remove series, and connect a new source from the editor.
What is a data source?
Every series on a widget reads from one data source. In Indicate that is an Insight: a set of metrics and dimensions that one of your connected systems delivers, for example Nordwind commerce from your shop or a Google Analytics 4 property. The Metric is the number the series shows, for example Revenue, Orders, or Sessions.
You pick both when you add a widget, and you can change both at any time in the widget editor without rebuilding the widget. Filters, comparisons, colors, and the chart type stay as they are.
Note: The data source list only shows Insights that exist in your space, including Insights another space shared with you. To see what is connected, open
Data sources. To connect a new system, an Admin clicks Connect in the editor or goes toData sources→Connections.
Where do I find the data source of a widget?
Open the dashboard and click the name of the widget. The widget editor opens on the right.
Scroll to the series block. Each series has four fields: Data source, Metric, Group by, and Search in time by.
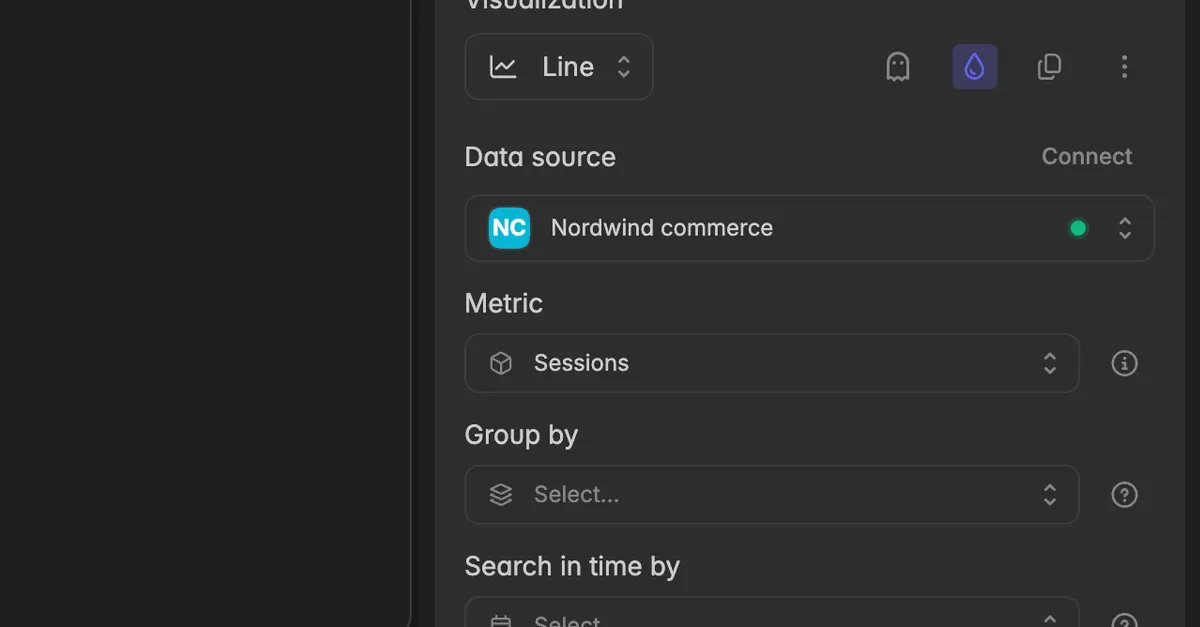
Data source: the Insight the series reads from. A dot next to the name shows the state of the connection behind it.
Metric: the number the series shows. The
iicon next to it shows the description of the metric.Group by: splits the metric by a dimension, so the chart shows one series per value, for example one per channel.
Search in time by: which date on each record decides the period it counts in, for example the day a request came in or the day of the stay. See Grouping and perspective.
Changes save on their own. There is no Save button, the widget on the board updates while you edit.
How do I change the data source of a widget?
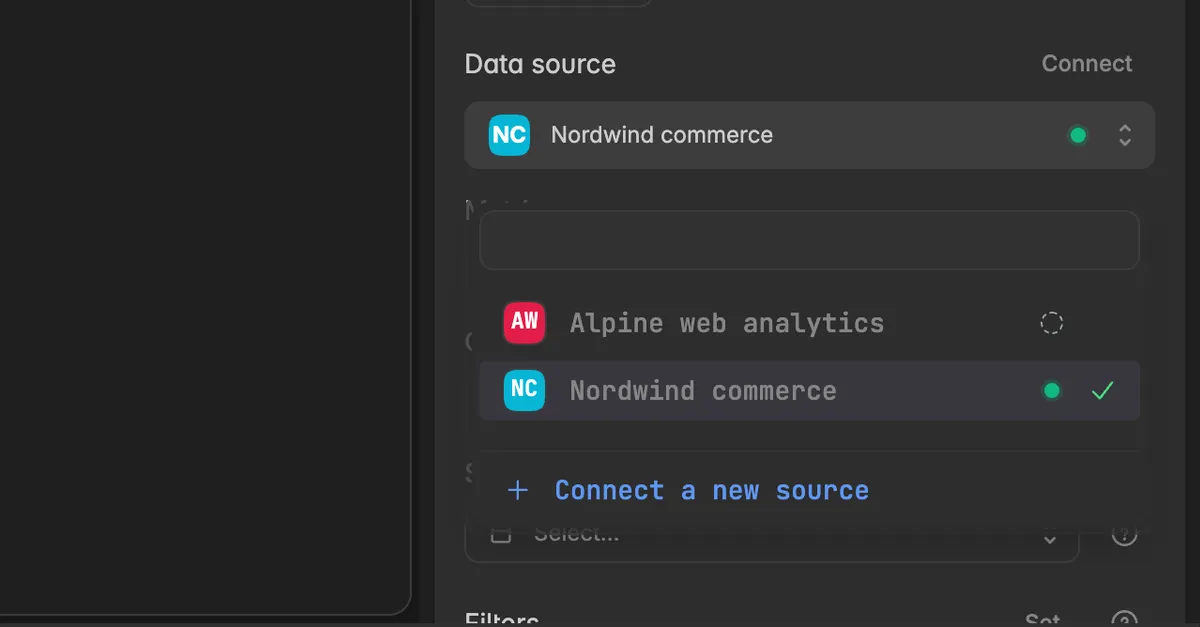
In the widget editor, click the Data source field of the series.
Pick another Insight from the list. Type to search. Click Connect a new source at the bottom to connect a system that is not listed yet.
Check Metric, Group by, and Search in time by. The new Insight may not carry the same metric or dimensions, so a field can fall back to Select… and needs a new pick.
Note: Filters are kept when you switch the source. If the new Insight does not have the dimension a filter uses, the series shows nothing until you adjust or remove the filter. See Filter data.
How do I change the metric of a widget?
In the widget editor, click the Metric field of the series.
Pick the metric from the list, for example
Ordersinstead ofSessions. Type to search.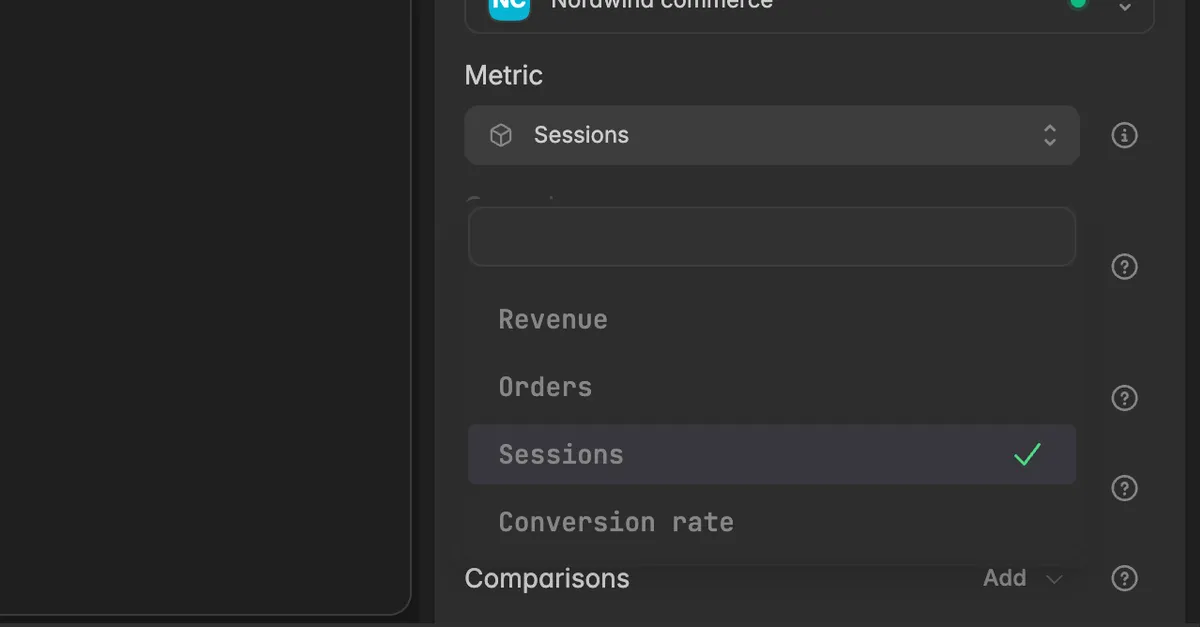
The widget keeps its layout, chart type, colors, and comparisons and now shows the new metric. Metrics that do not exist in the selected Insight are not offered.
How do I split a metric by a dimension?
In the widget editor, click Group by on the series.
Pick a dimension, for example
ChannelorCountry. Only the dimensions the metric supports are listed.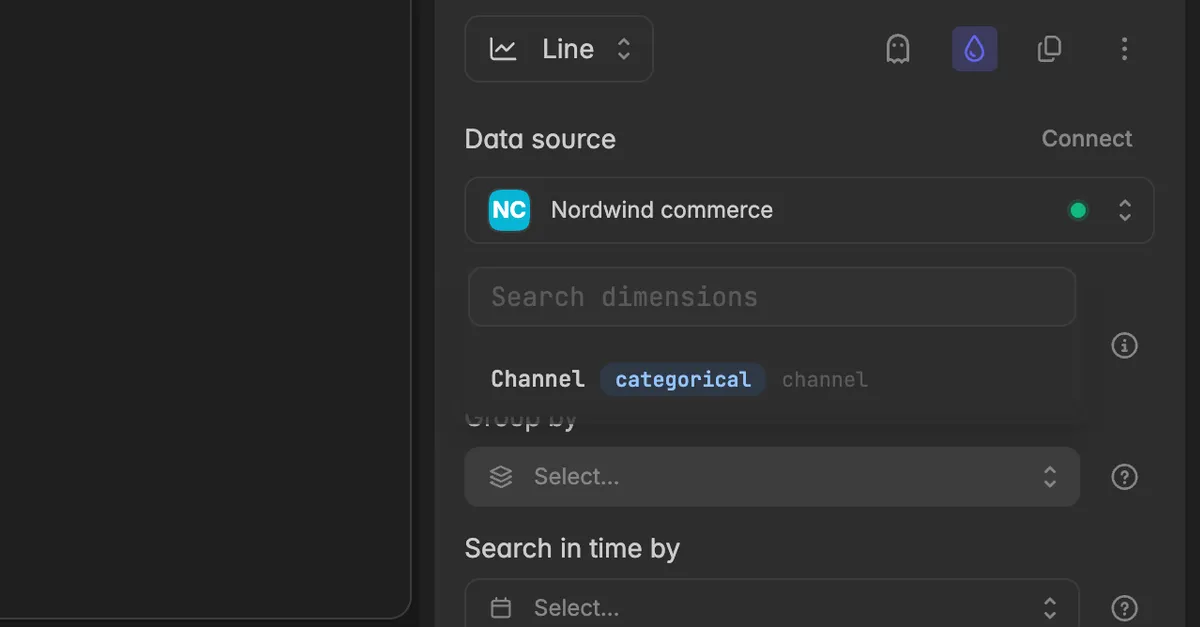
The chart now draws one series per value, for example one line per channel. For Group by time, the spacing of the points on the time axis, see Grouping and perspective.
How do I combine several metrics or sources in one widget?
A widget can hold several series, from the same Insight or from different ones. That is how you show revenue next to bookings, or shop traffic next to PMS reservations, in one chart.
In the widget editor, click Add series at the top.
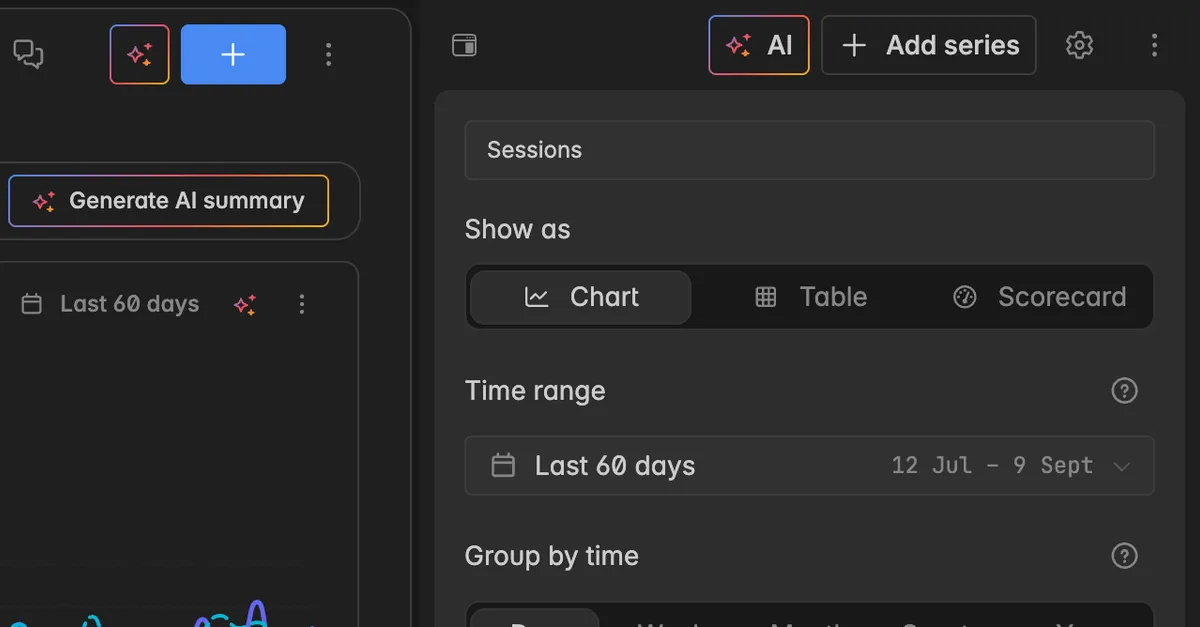
A new, empty series block appears below the existing one. A banner One series has no data behind it yet reminds you which fields are still missing. Click the entry in the banner to jump to that series.
Set Data source, Metric, and the dimensions for the new series.
Give the series a Series display name in the field at the top of its block, so the legend reads well.
Every series has its own Visualization, color, filters, comparisons, and guide lines. To start from an existing series, click the copy icon Duplicate this series in its header and change only the metric.
How do I remove a series from a widget?
In the widget editor, click the
⋮icon Series actions in the header of the series.Select Delete.
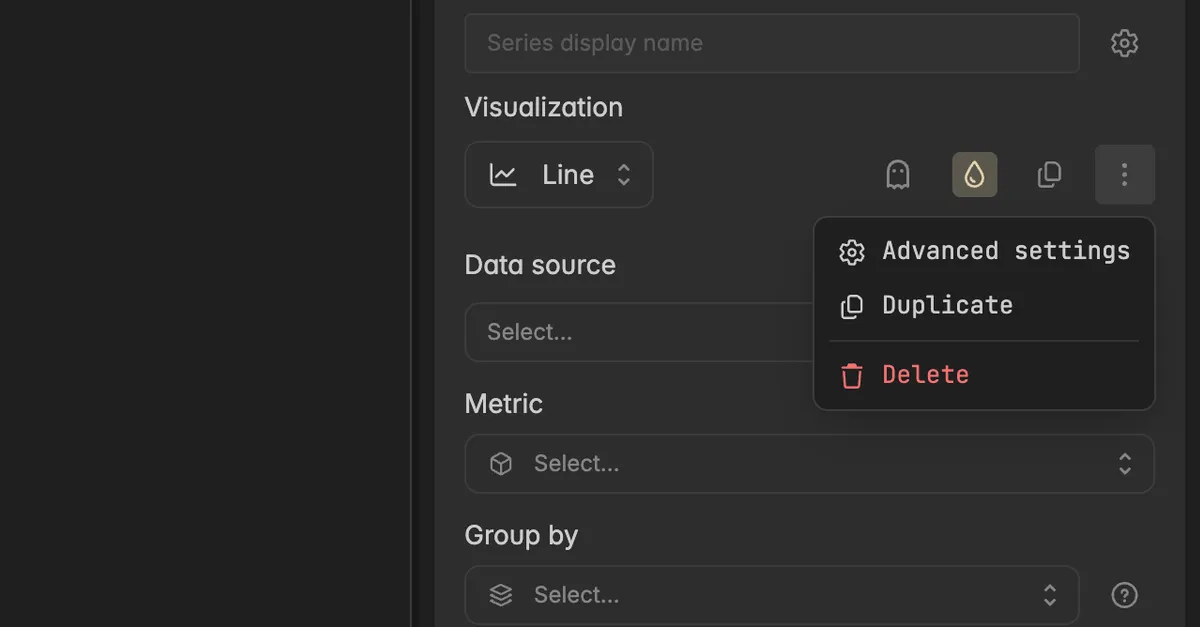
The other series stay. If you remove the last series, the widget stays on the board and shows Nothing to show yet until you add a series again. To remove the whole widget, use Delete widget in the widget menu, see Create a widget.
How do I connect a new source from the editor?
If the Insight you need does not exist yet, you can start the connection without leaving the dashboard.
Click Connect next to the Data source label, or Connect a new source at the bottom of the data source list.
The dialog Connect a data source lists the systems you can connect, for example Google Analytics 4, Shopify, or a CSV upload. Pick one and follow the steps. See Add a data source.
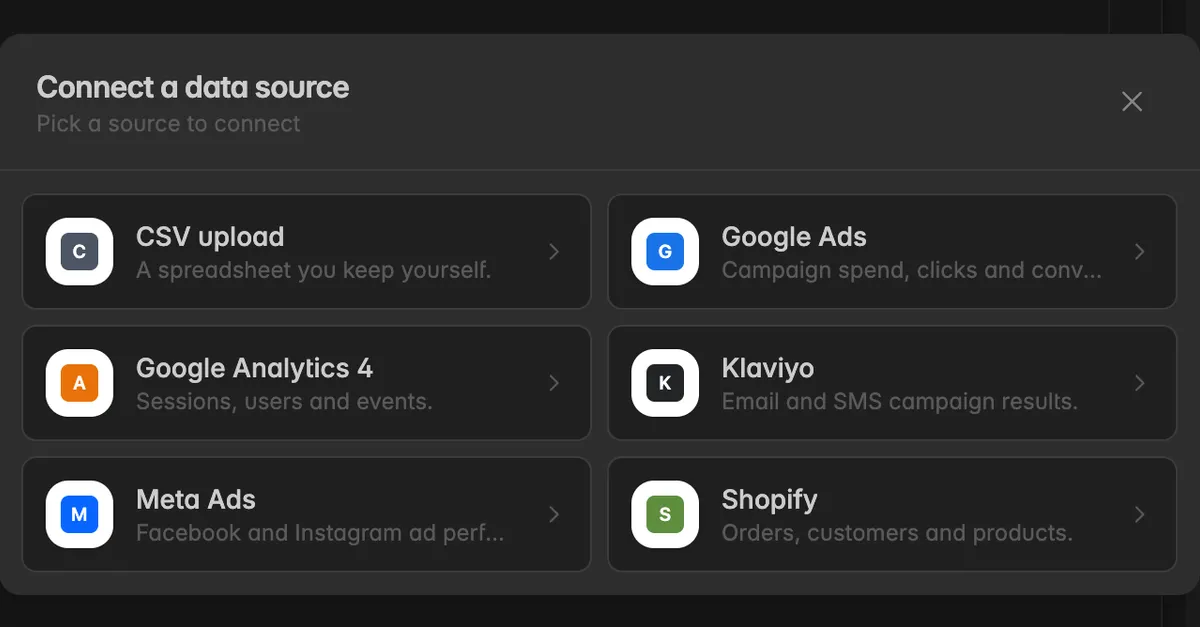
Note: Connecting a source requires the Admin role. Once the connection has delivered data, the new Insight appears in the Data source list of every widget.
What happens when the data behind a widget retires?
A connection or a metric can be retired, for example when a provider switches off an old API or your team replaces an Insight. Indicate warns you on the widget before that happens, so you can move it in time.
Before the date: the widget header shows a yellow warning triangle. Hover over it to read The data behind this widget retires on [date]. Move this widget to a replacement before then. Below, the popover lists what is affected: the Connection, the Metric and its source, and how many series depend on it.
After the date: the triangle stays and the text reads The data behind this widget was retired on [date] and no longer returns data. The widget shows no data until you point it at a replacement.
To move the widget, open the editor and pick the replacement Insight under Data source and the metric under Metric, as described above. Filters, comparisons, and the chart type stay as they are.
Note: A grey
iicon in the same place means something else: not every series is drawn. Hover over it to see N of M series shown and whether the rest are hidden or returned no data.
Troubleshooting
I see no data, or only zeros
First widen the Time range to All time and check whether any data appears. If still nothing, check the source system itself: if there is no data for that metric and period there, Indicate cannot show any.
A newly connected source starts collecting from the moment it was connected. Depending on the integration it can take up to 72 hours until data arrives.
Admins can check the connection under
Data sources→Connections. A connection that needs attention is also listed on the Home page.
The data source I want is not in the list
- Only Insights in your space are listed. Open
Data sourcesto check whether the system is connected and has an Insight. If not, an Admin connects it with Connect.
The banner says one series has no data behind it yet
- A series draws nothing until Data source, Metric, and the dimensions it needs are all picked. The banner names the missing fields. Click the entry to jump to the series and fill them in.
My widget went empty after I changed the source or metric
A filter from the previous metric is probably still active and matches nothing in the new one. Open Filters on the series and adjust or remove it.
The new Insight may not carry the dimension used in Group by or Search in time by. Pick a new one.
Two sources show contradicting numbers
- Each source records what it sees. A booking engine only counts online bookings, while the PMS also holds walk-ins and phone reservations, so the PMS always shows more. Check how each system defines the metric before you compare them.
Was this helpful?