
Ranking
Sort and limit the categories of a widget: rank by value, name, or change, show the top or bottom N, fold the rest into Others, and handle missing values.
What is ranking?
Ranking sorts the categories of a widget and limits how many are shown, for example the top 5 channels by revenue or the bottom 3 pages by conversion rate. It applies before the data is drawn, so the widget shows only the ranked subset. Everything else can be folded into one Others category.
Ranking is a setting of the whole widget, not of one series, and it needs a category to rank: a series with a Group by dimension such as channel or country. It works on every widget type and is most useful on pie charts, bar charts, and tables.
How do I rank or limit the categories?
Editing needs at least the User role.
Open the dashboard and click the name of the widget. The widget editor opens on the right.
Click the gear icon Advanced widget settings at the top of the editor, next to Add series. Or open the
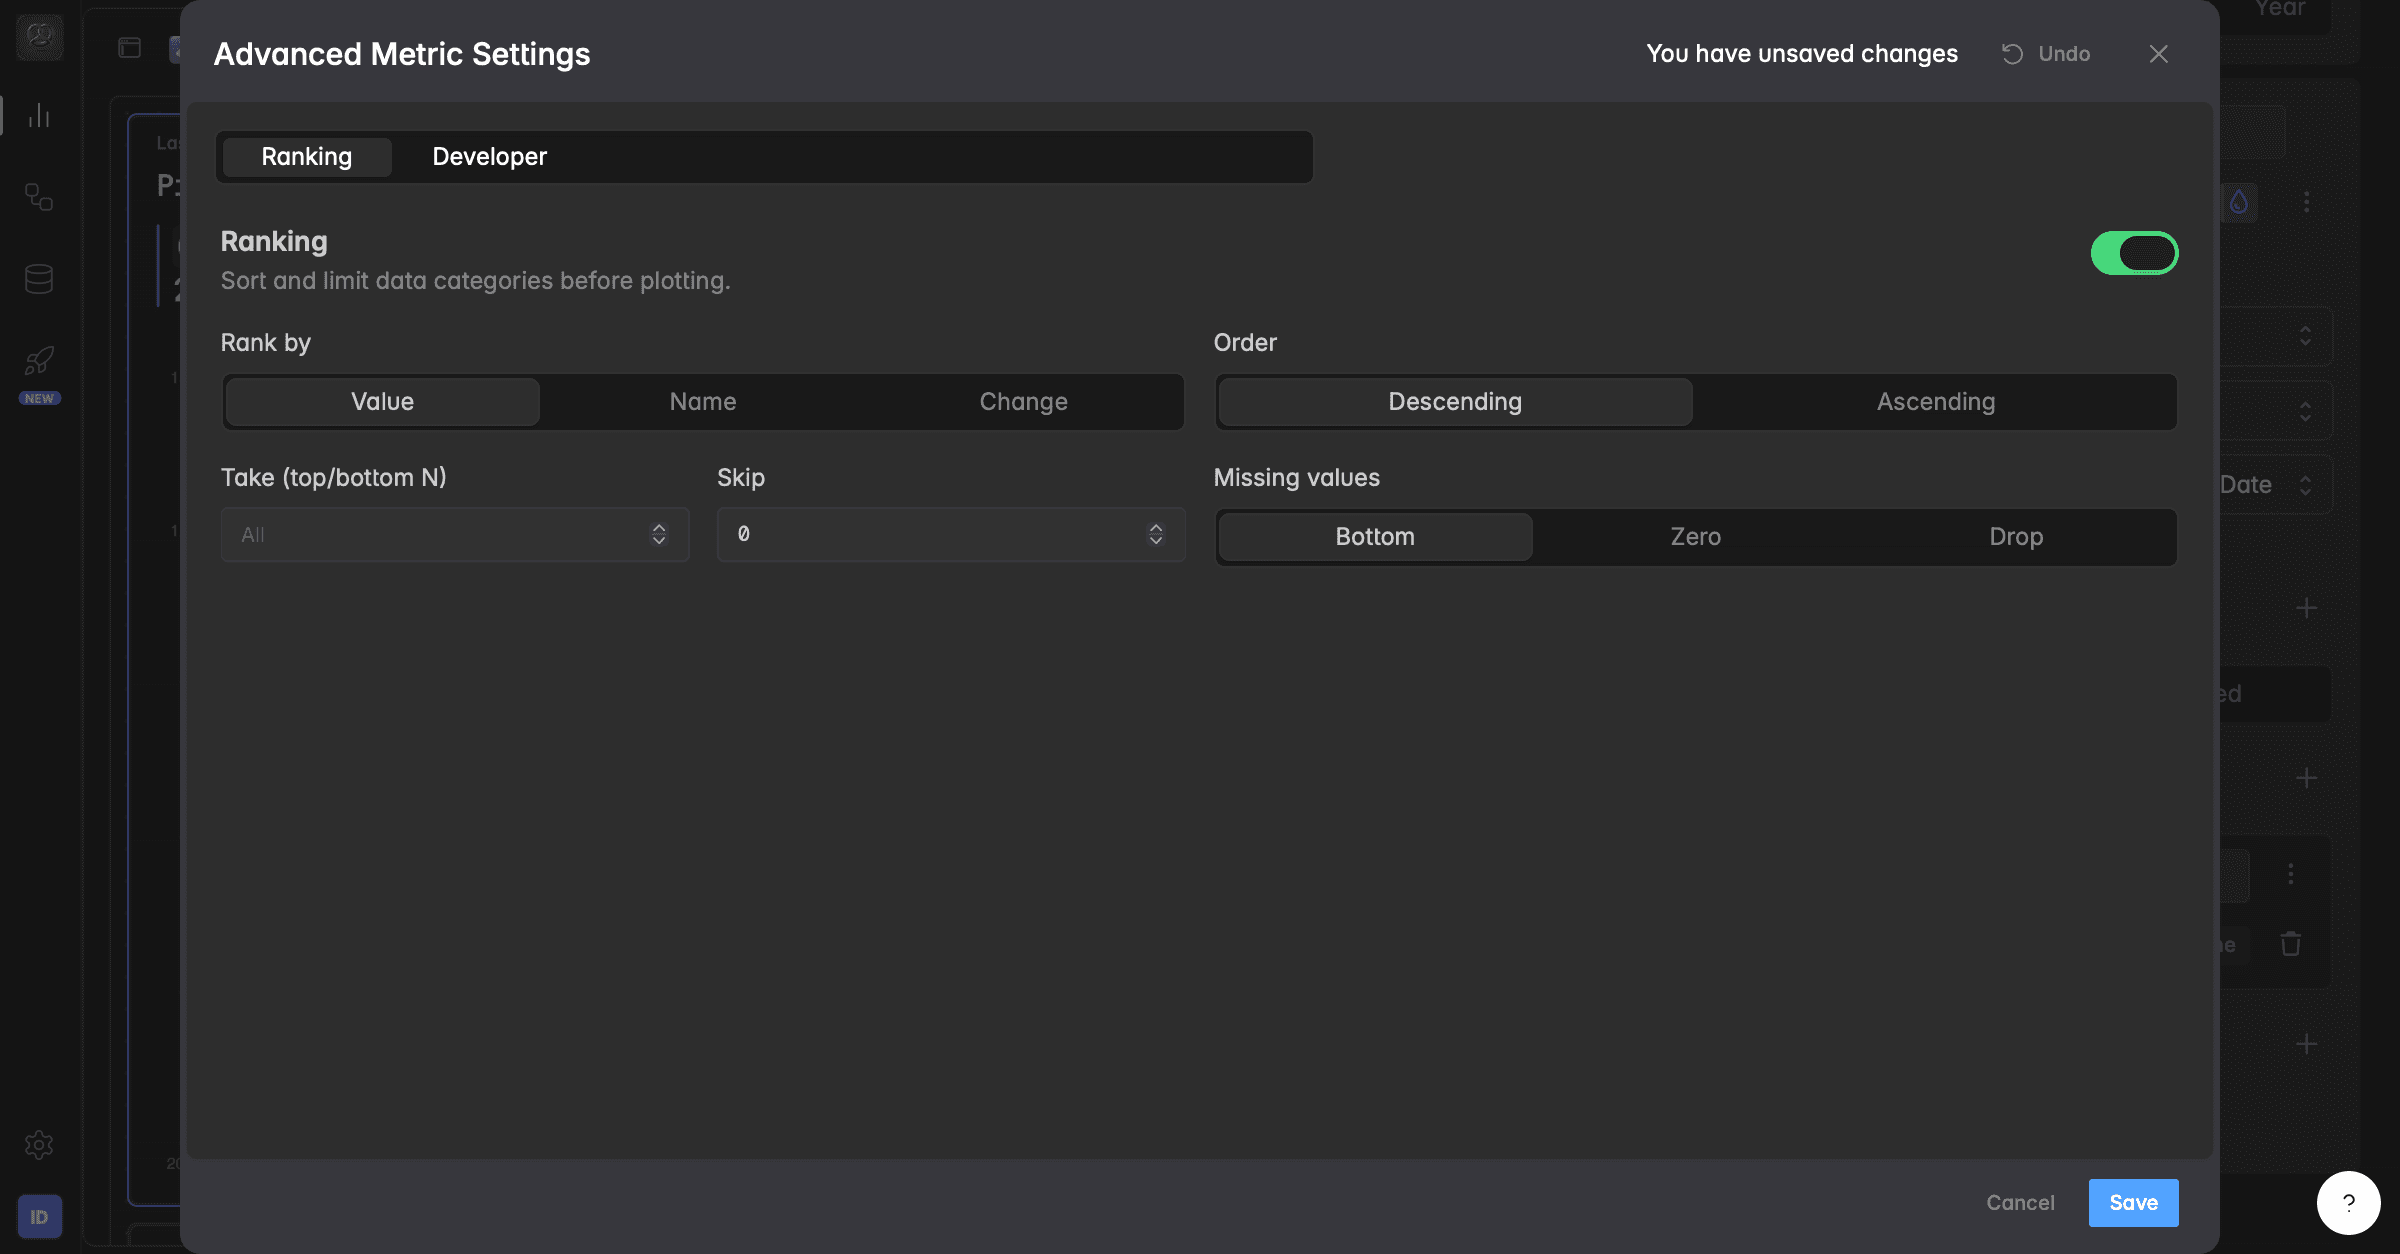
⋮widget menu and select Advanced settings.The dialog Advanced settings opens on the Ranking tab. Turn on the Ranking switch.
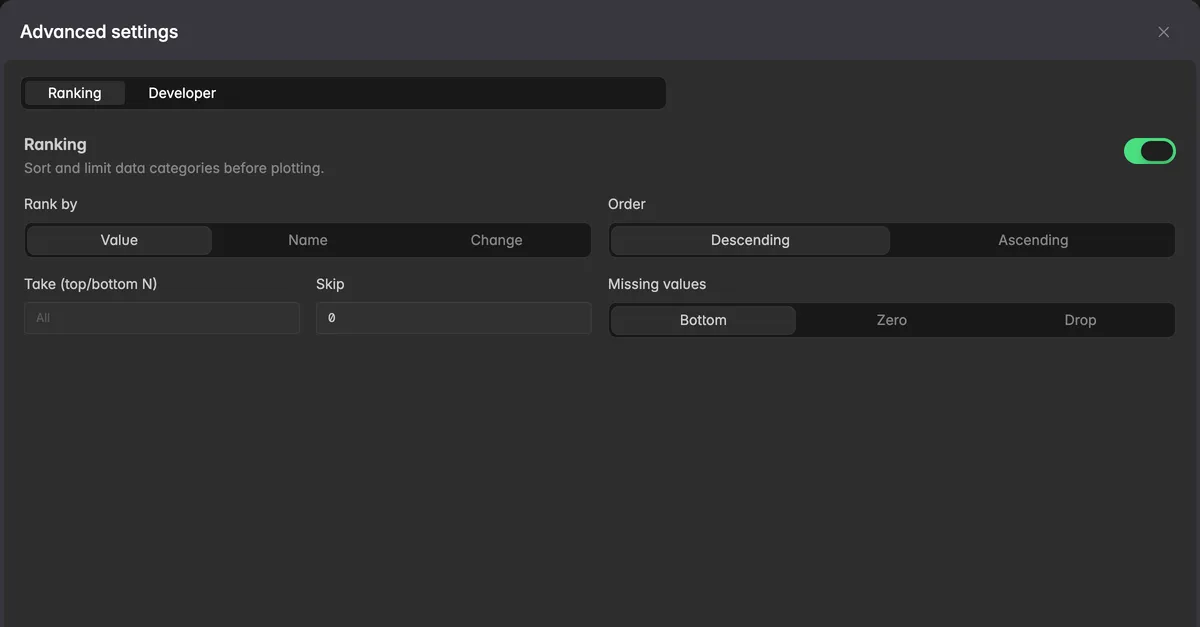
Set the options described below, then click Save.
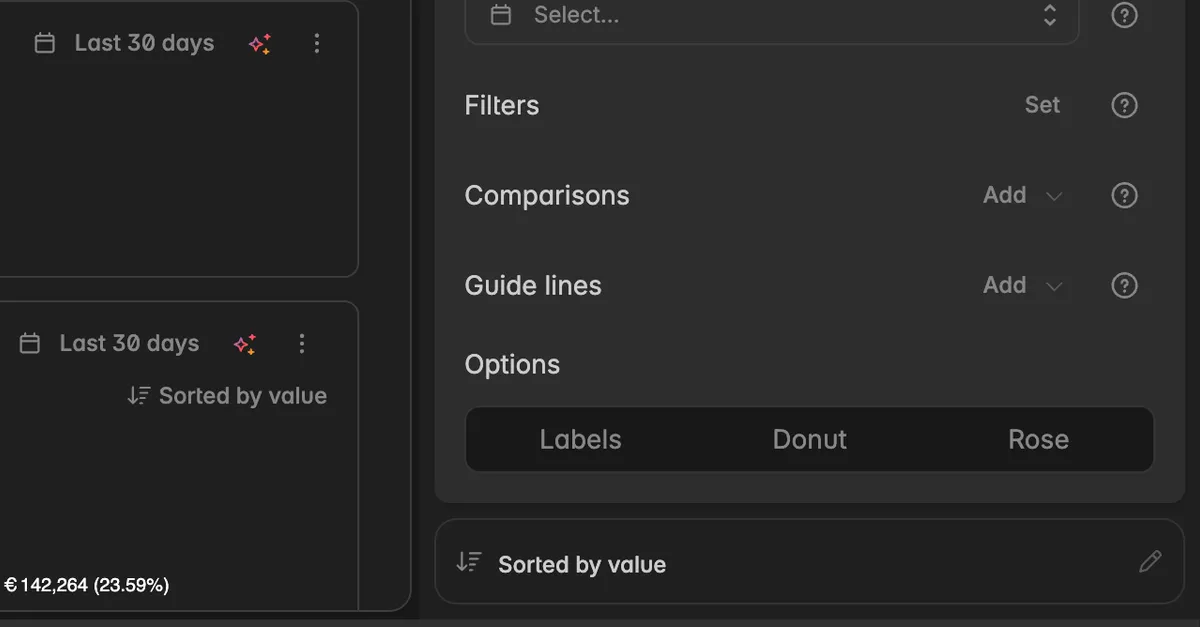
The editor now shows a chip at the bottom of the series, for example Sorted by value or Top 3 by value. Click the pencil on the chip to open the settings again.
What ranking options are there?
Rank by
Value: sorts by the metric value, for example revenue. This is the default.
Name: sorts alphabetically by the dimension value.
Change: sorts by how much the value changed over time. A second field Change mode appears to choose Percentage or Absolute.
Order
Descending: the highest first. This is the default.
Ascending: the lowest first.
Take and Skip
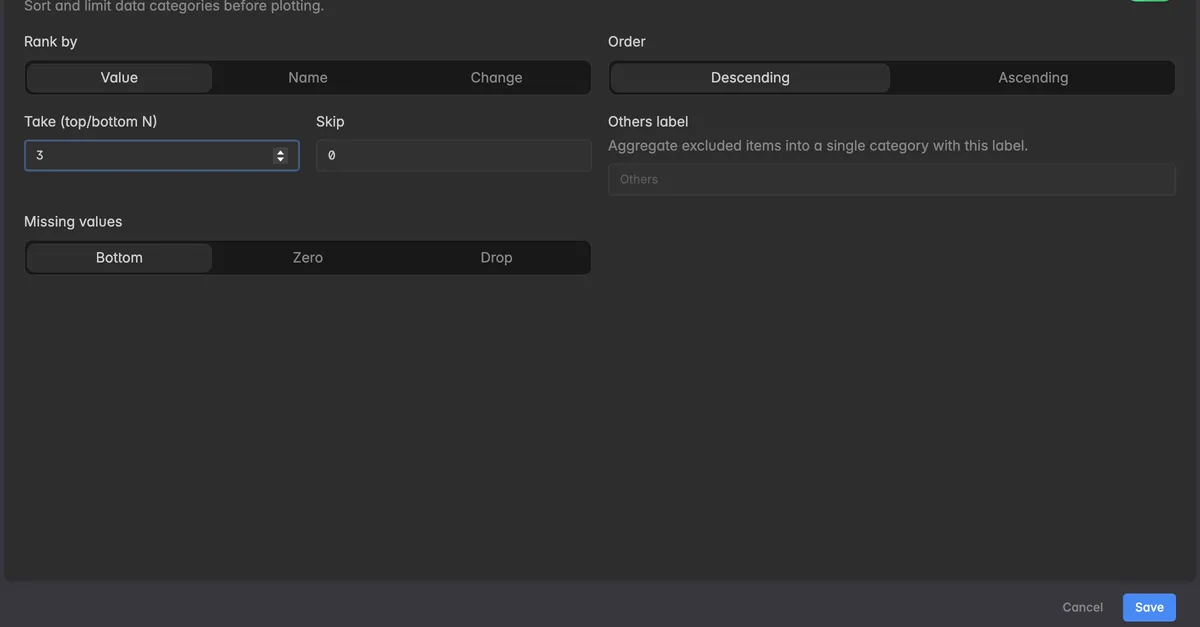
Take (top/bottom N): how many categories are shown.
5with Descending shows the top 5, with Ascending the bottom 5. Empty means All.Skip: how many categories are left out at the top before the count starts. Skip
5and Take5shows the categories ranked 6 to 10.
Others label
Appears once Take is set. Type a label, for example Others, and every category that did not make the cut is added up into one category with that name. Leave it empty to drop them.
Missing values
How categories without a value are ranked:
Bottom: they go to the end of the list. This is the default.
Zero: they are ranked as if their value were 0.
Drop: they are left out.
How do I see that a widget is ranked?
On the dashboard, a ranked widget shows a chip below its time range, for example Top 3 by value. Hover over it to read what the ranking does, for example Top 3 of the results, by value, highest first. The remaining rows are not shown.
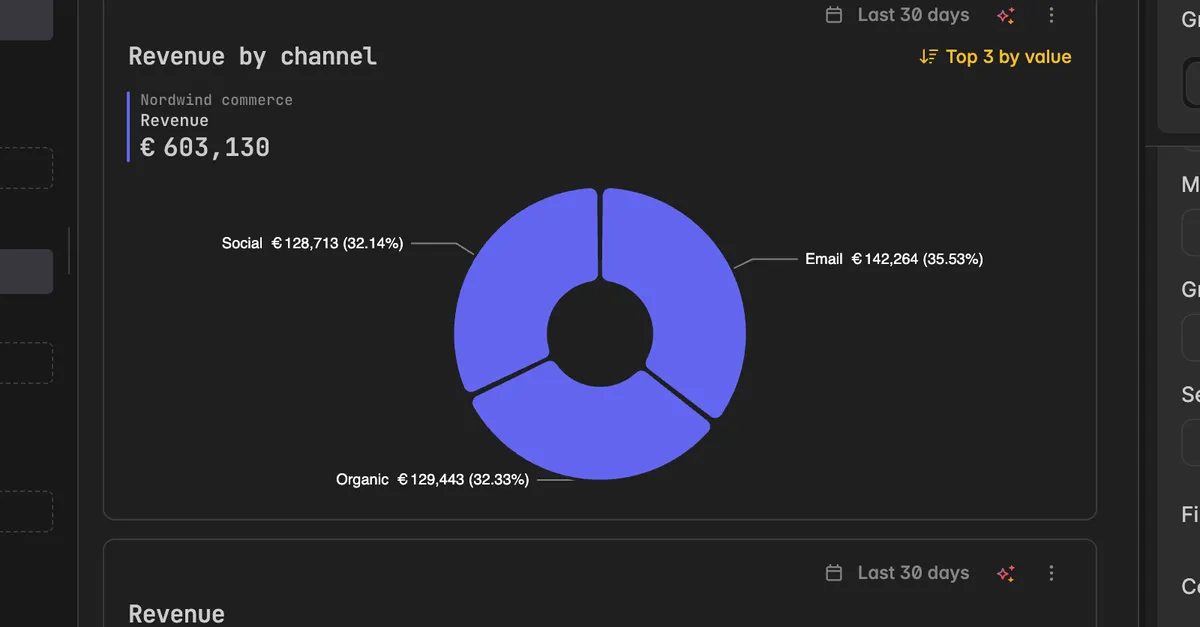
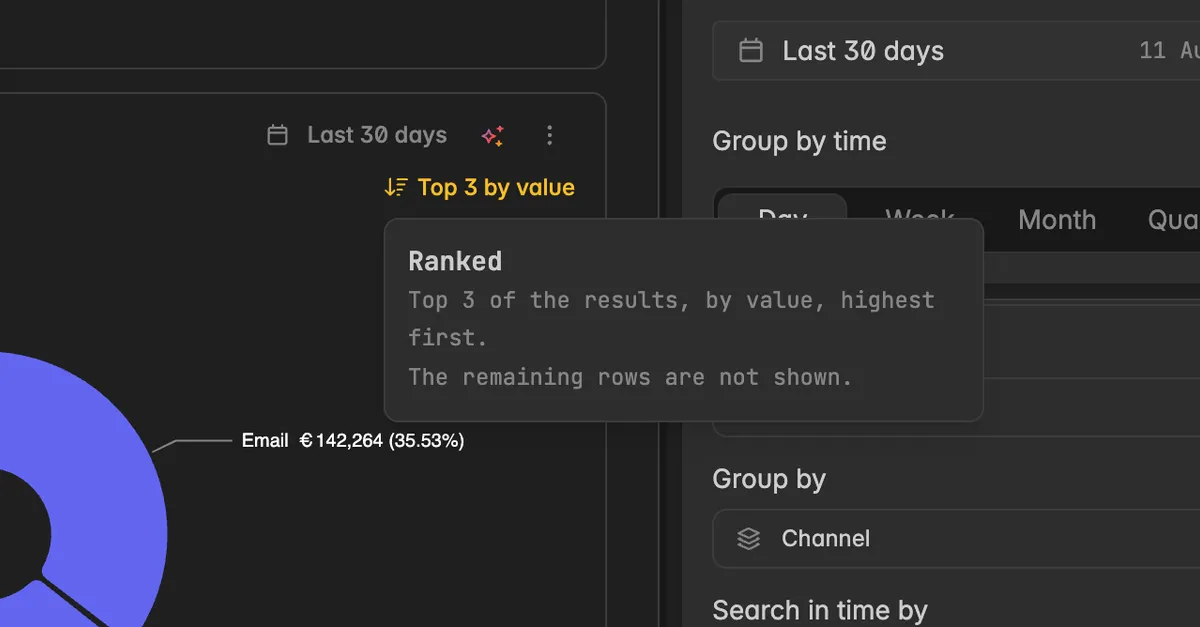
In the editor the same chip sits at the bottom of the series. When the ranking hides rows, it adds some rows are not shown.
Troubleshooting
The widget shows only a few categories
- A Take limit is set. Open Advanced widget settings, and clear Take or raise the number. Set an Others label if the rest should stay visible as one category.
Ranking has no visible effect
- There is nothing to rank. Ranking sorts categories, so the series needs a Group by dimension such as channel or country. A series over time without a dimension is not affected.
The order looks wrong
- Check Rank by and Order. Name sorts alphabetically, not by size. Change sorts by growth, so a small category with a big jump can come first.
Categories without data are at the top
- Set Missing values to Bottom or Drop.
Was this helpful?