
Change formatting
Set the numeric style, rounding, decimals, prefix and postfix of a series, and choose the headline statistic a chart shows.
What does formatting change?
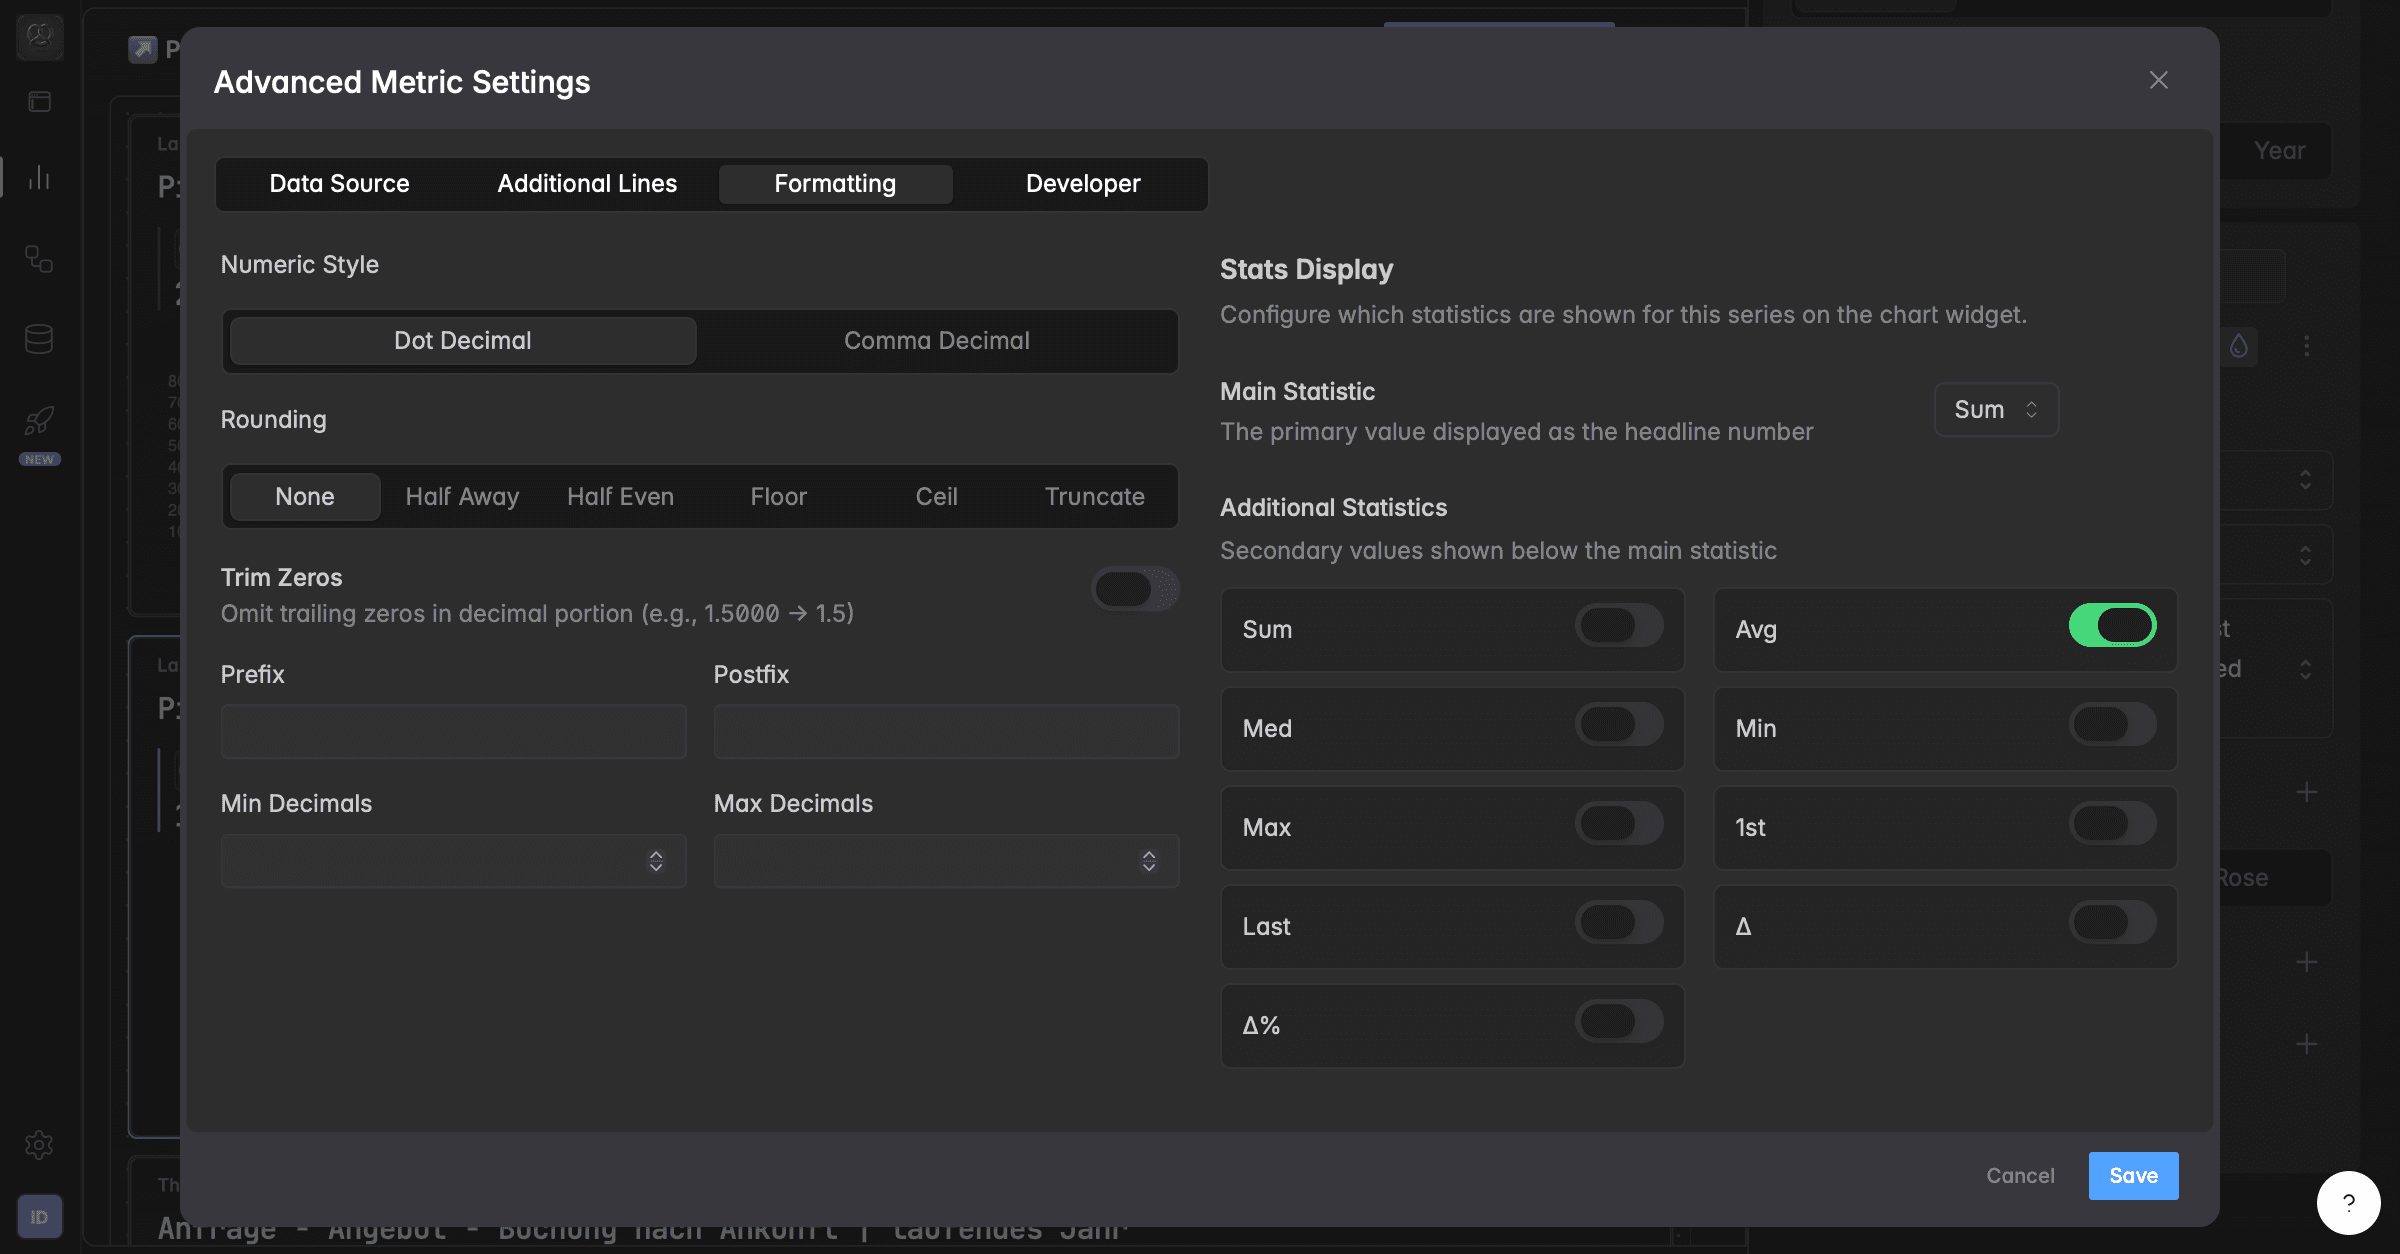
Formatting defines how the numbers of a series are written: the decimal separator, rounding, the number of decimals, and a prefix or postfix such as € or %. It changes the display only, never the data. The same settings also decide which statistic a chart shows as its headline number.
Formatting is set per series in the widget editor. On a widget with a revenue series and a conversion rate, each one gets its own format.
How do I open the formatting settings?
Editing needs at least the User role.
Open the dashboard and click the name of the widget. The widget editor opens on the right.
In the header of the series, click the gear icon Advanced series settings. Or click
⋮and select Advanced settings.In the dialog Advanced settings, open the Formatting tab.
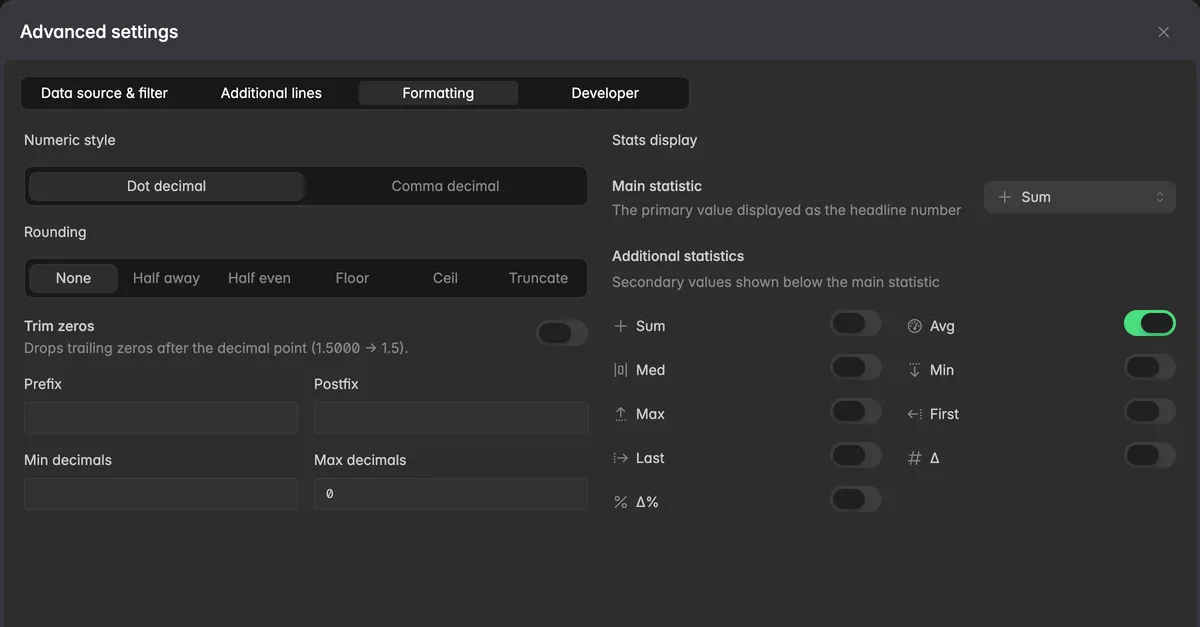
Change the settings, then click Save. Reset puts the tab back to the saved state.
What can I set?
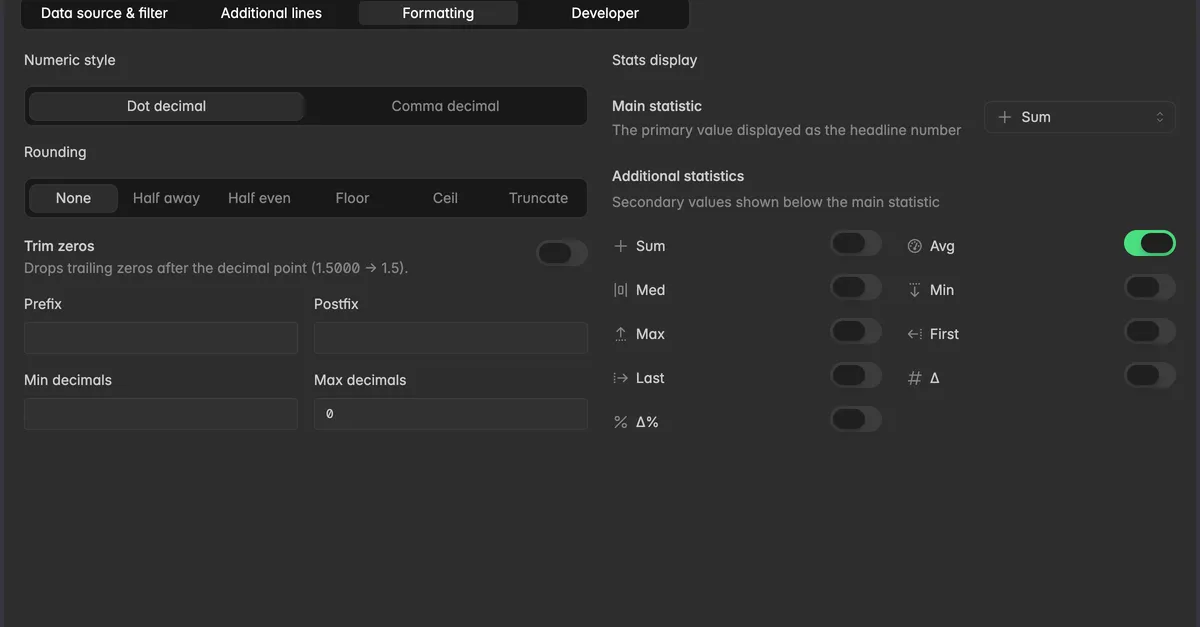
Numeric style
Dot decimal:
1,000.50, a dot for decimals and a comma for thousands.Comma decimal:
1.000,50, a comma for decimals and a dot for thousands.
Rounding
| Option | What it does | Example |
|---|---|---|
| None | Shows the full value. | 2.3456 stays 2.3456 |
| Half away | Rounds halves away from zero. | 2.5 becomes 3 |
| Half even | Rounds halves to the nearest even number. | 2.5 becomes 2 |
| Floor | Rounds down. | 2.9 becomes 2 |
| Ceil | Rounds up. | 2.1 becomes 3 |
| Truncate | Cuts off the decimals without rounding. | 2.99 becomes 2 |
Trim zeros
Turn on Trim zeros to drop trailing zeros after the decimal point. 1.5000 becomes 1.5, 3.1400 becomes 3.14.
Prefix and postfix
Text written before or after every value.
Prefix: for example
€for€100or#for#1.Postfix: for example
%for75%,msfor200ms, orxfor10x.
Min decimals and Max decimals
Min decimals: at least this many decimals are always shown.
2turns3into3.00.Max decimals: never more than this many.
2turns3.14159into3.14.
Note: A metric brings a default precision with it, for example two decimals for money and none for counts. Set Min decimals and Max decimals only when you want to override that.
How do I choose the headline number of a chart?
On a chart widget the header shows one number per series, for example the total of the range, with smaller statistics below it. This is the Stats display on the same Formatting tab. It applies to chart widgets only. A scorecard picks its number under Options in the editor, see Change widget type.
Under Stats display, click Main statistic and pick the headline number.
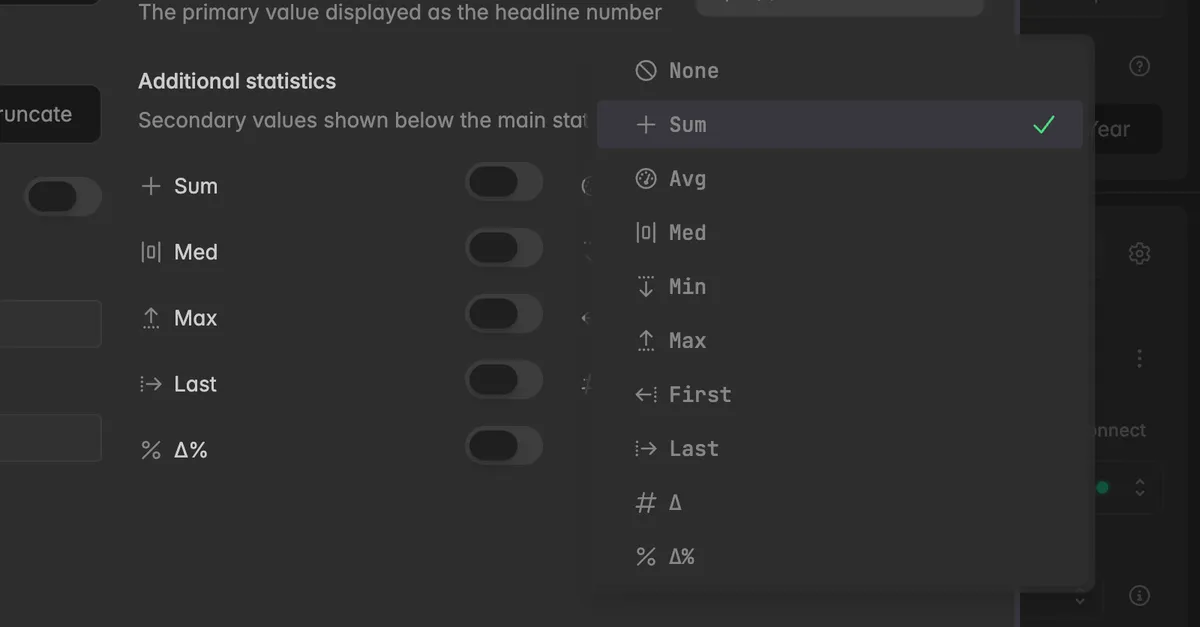
Sum: the total of every value in the range.
Avg, Med: the average or the median.
Min, Max: the lowest or highest value.
First, Last: the first or the latest value in the range.
Δ, Δ%: the change from the first to the last value, absolute or in percent.
None: no headline number.
Under Additional statistics, turn on every value that should appear below the main statistic.
Click Save.
On a Table or Scorecard widget the section reads Charts only. Switch the widget to a chart to set it up.
Troubleshooting
My change is not visible
- Formatting is per series. Open the advanced settings of the series you changed and check that you clicked Save. The tab shows You have unsaved changes while something is pending.
The values show too many decimals
- Set Max decimals to the number you want, for example
0for whole numbers, and pick a Rounding other than None.
The currency sign is on the wrong side
- Use Prefix for signs in front of the number, for example
€, and Postfix for signs after it, for example%orCHF.
Stats display is greyed out
- The section only works on chart widgets. Under Show as in the editor, switch the widget to Chart.
Was this helpful?