
Edit a widget with AI
Describe a change in one sentence and let AI rebuild a single widget in place, without touching the rest of the dashboard.
What does editing a widget with AI do?
Instead of changing the visualization, the grouping, or the comparisons by hand, you describe the change in one sentence and let AI rebuild the widget. The widget keeps its size and its place on the board, everything inside it can change: the chart type, the series, the time range, filters, comparisons, and the name.
It is the widget-sized version of Edit with AI for a whole dashboard. Use it when you know what you want to see but not which of the editor's fields to touch, for example "show it as a bar chart by week, and compare with last year".
Editing needs at least the User role. Readers do not see the sparkle icon.
Every change is a separate AI call and uses AI budget, like generating a dashboard. See Create a dashboard for the model and effort pickers and the budget.
AI can misread the data. Check the figures before acting on them.
How do I change a widget with AI?
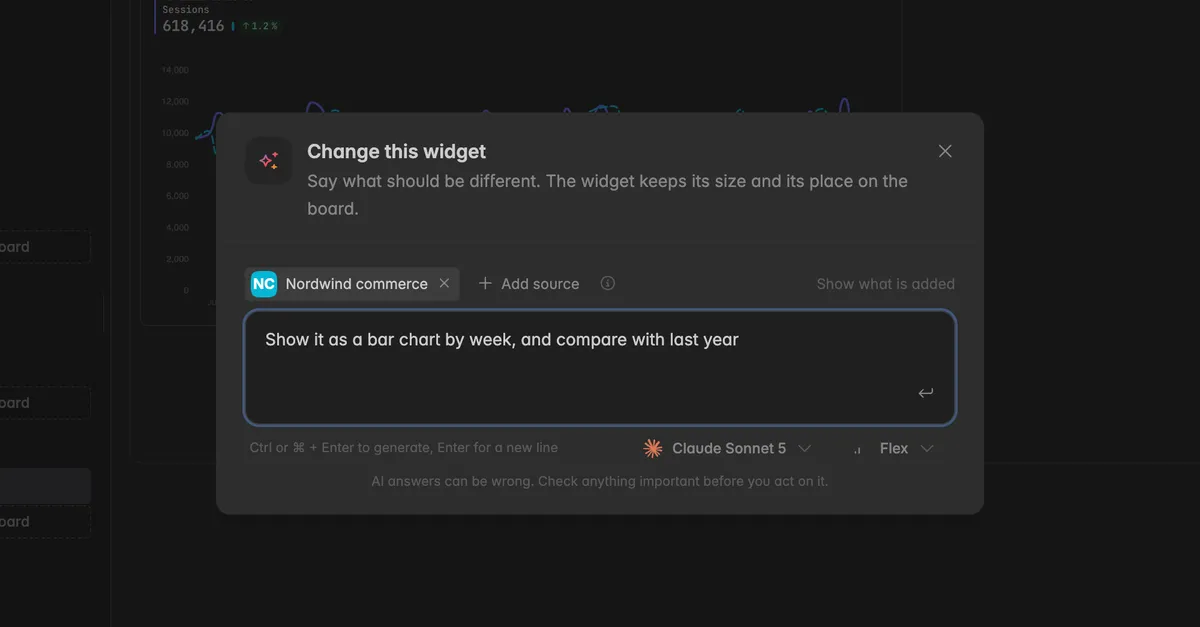
Open the dashboard. In the header of the widget, click the sparkle icon. The tooltip reads Change this widget with AI. In the widget editor the same button sits at the top and is labelled AI.
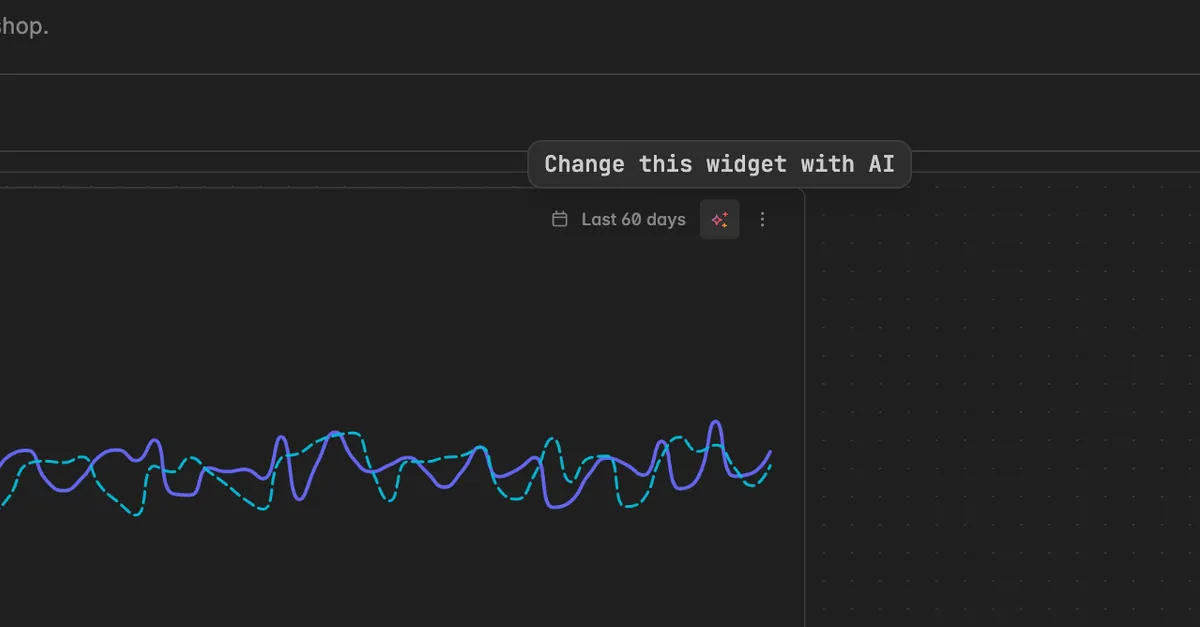
The dialog Change this widget opens. Above the field you see the sources the AI builds from, by default the Insights the widget already reads. Click Add source to include another Insight, or the
xon a chip to leave one out. Show what is added lists the metrics that go along with the sources.Type what should be different, for example
Show it as a bar chart by week, and compare with last year. Say what you want, not how to set it. The widget already carries its current setup.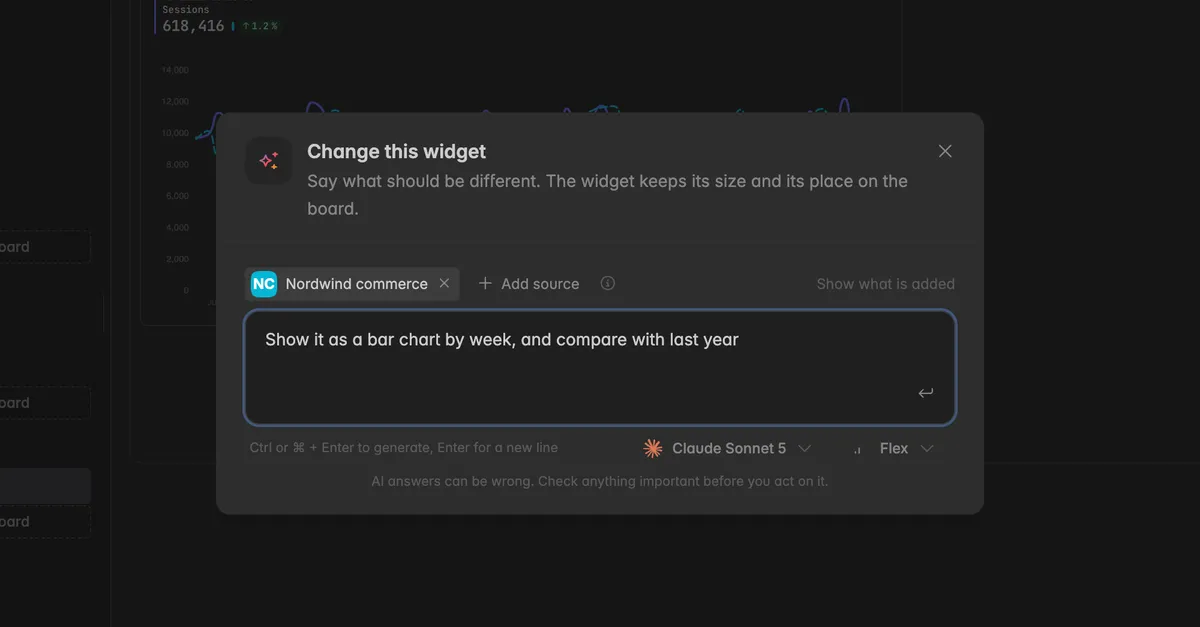
Pick a model and an effort below the field if needed. The defaults are fine for most changes.
Press Ctrl + Enter or ⌘ + Enter, or click the arrow button at the end of the field. Enter alone adds a new line.
The dialog closes and the widget goes grey with the note This widget is being changed. Widgets cannot be moved, resized, or changed with AI until it lands. This usually takes under a minute, and you can leave the page in the meantime.
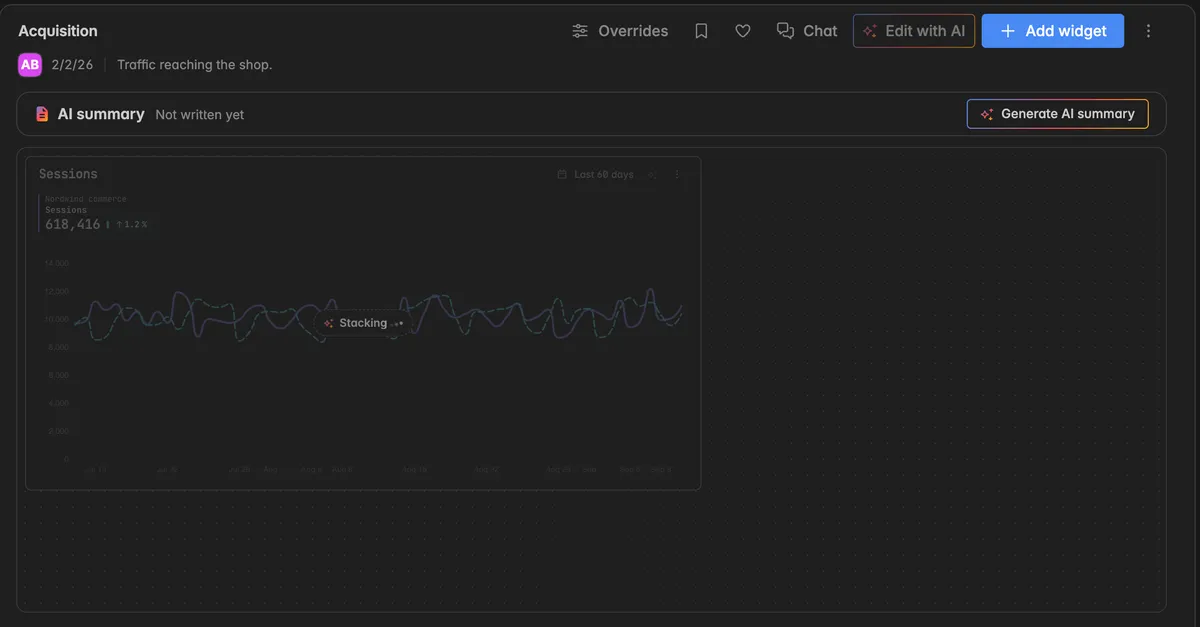
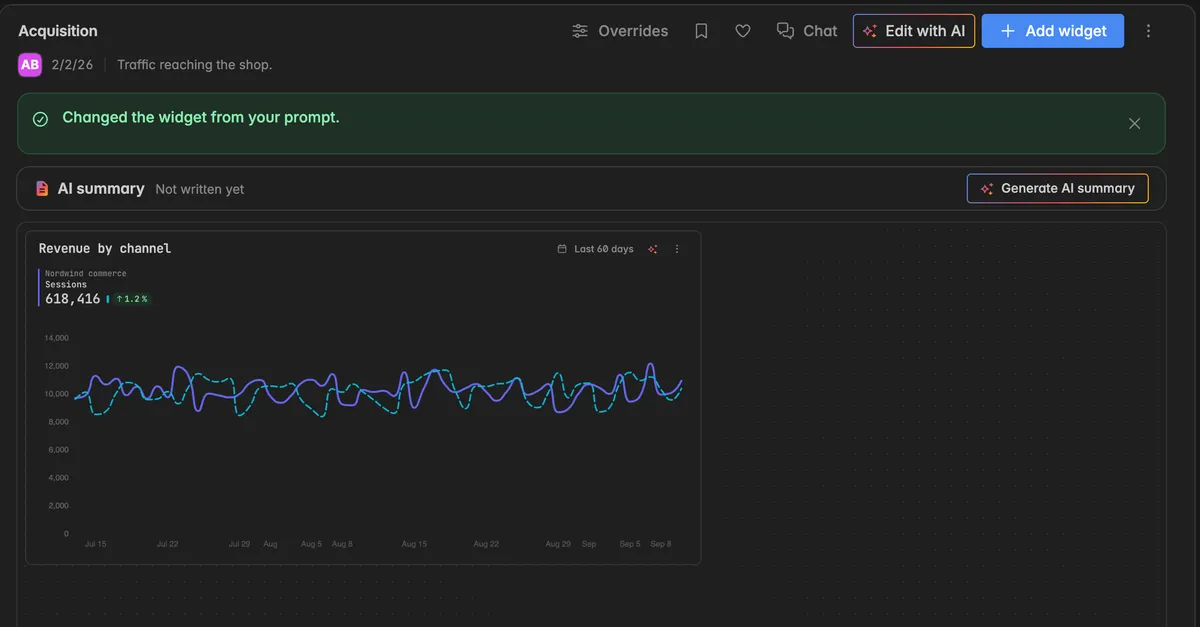
When the change has landed, a green banner Changed the widget from your prompt appears above the board and the widget shows its new state. Click the x to dismiss the banner.
What can I ask for?
Anything the widget editor can set. Some examples:
Chart type: "make it a column chart", "show it as a scorecard".
Grouping and time: "by month", "split by channel", "last 90 days".
Comparisons and guide lines: "compare with last year", "add a target line at 12,000".
Series: "add orders as a second line", "drop the sessions series".
Naming and style: "call it Traffic by channel", "stack the bars".
If the result is not what you meant, run it again with a clearer sentence, or open the widget editor and adjust the details by hand. See Create a widget for the editor.
Where else can I use AI on a dashboard?
Add a widget with AI: click Add widget and leave the switch on Let AI build it. The widget is designed to match the dashboard and placed where it fits. See Create a widget.
Edit with AI in the dashboard toolbar rebuilds the whole board around your change. Widgets made by hand may be redesigned, so prefer the widget-sized change when only one widget should move.
AI summary above the widgets writes a short read of the dashboard. See Create a dashboard.
Troubleshooting
The sparkle icon is not on the widget
Changing a widget with AI needs at least the User role. Readers see the dashboard but no editing controls.
While another widget is being built or changed, the icon is disabled with the tooltip Wait for the current AI run to land.
The banner says The widget could not be changed
- The AI could not turn the prompt into a valid widget, for example because it asked for a metric the sources do not have. Dismiss the banner and try again with a clearer sentence, or open the widget editor and make the change by hand. The widget keeps its previous state.
The prompt is over the limit
- The counter under the field shows how many characters you used and the limit. The sources count towards it, marked (incl. sources). Shorten the prompt or remove a source with the
xon its chip.
The AI budget is used up
- The dialog tells you that the space has used its AI budget for this period and when it resets. Change the widget by hand in the editor, or go to
Settings→Billing→AI usageto see the budget.
The change looks different from what I asked
- AI works from the metrics the sources provide. If a metric or dimension does not exist there, it picks the closest match. Check the series in the widget editor and correct the field by hand.
Was this helpful?