
↵Öffnen
Indicate changelog
Changelog
Die neuesten Releases und Verbesserungen von Indicate.
Sicherer Login
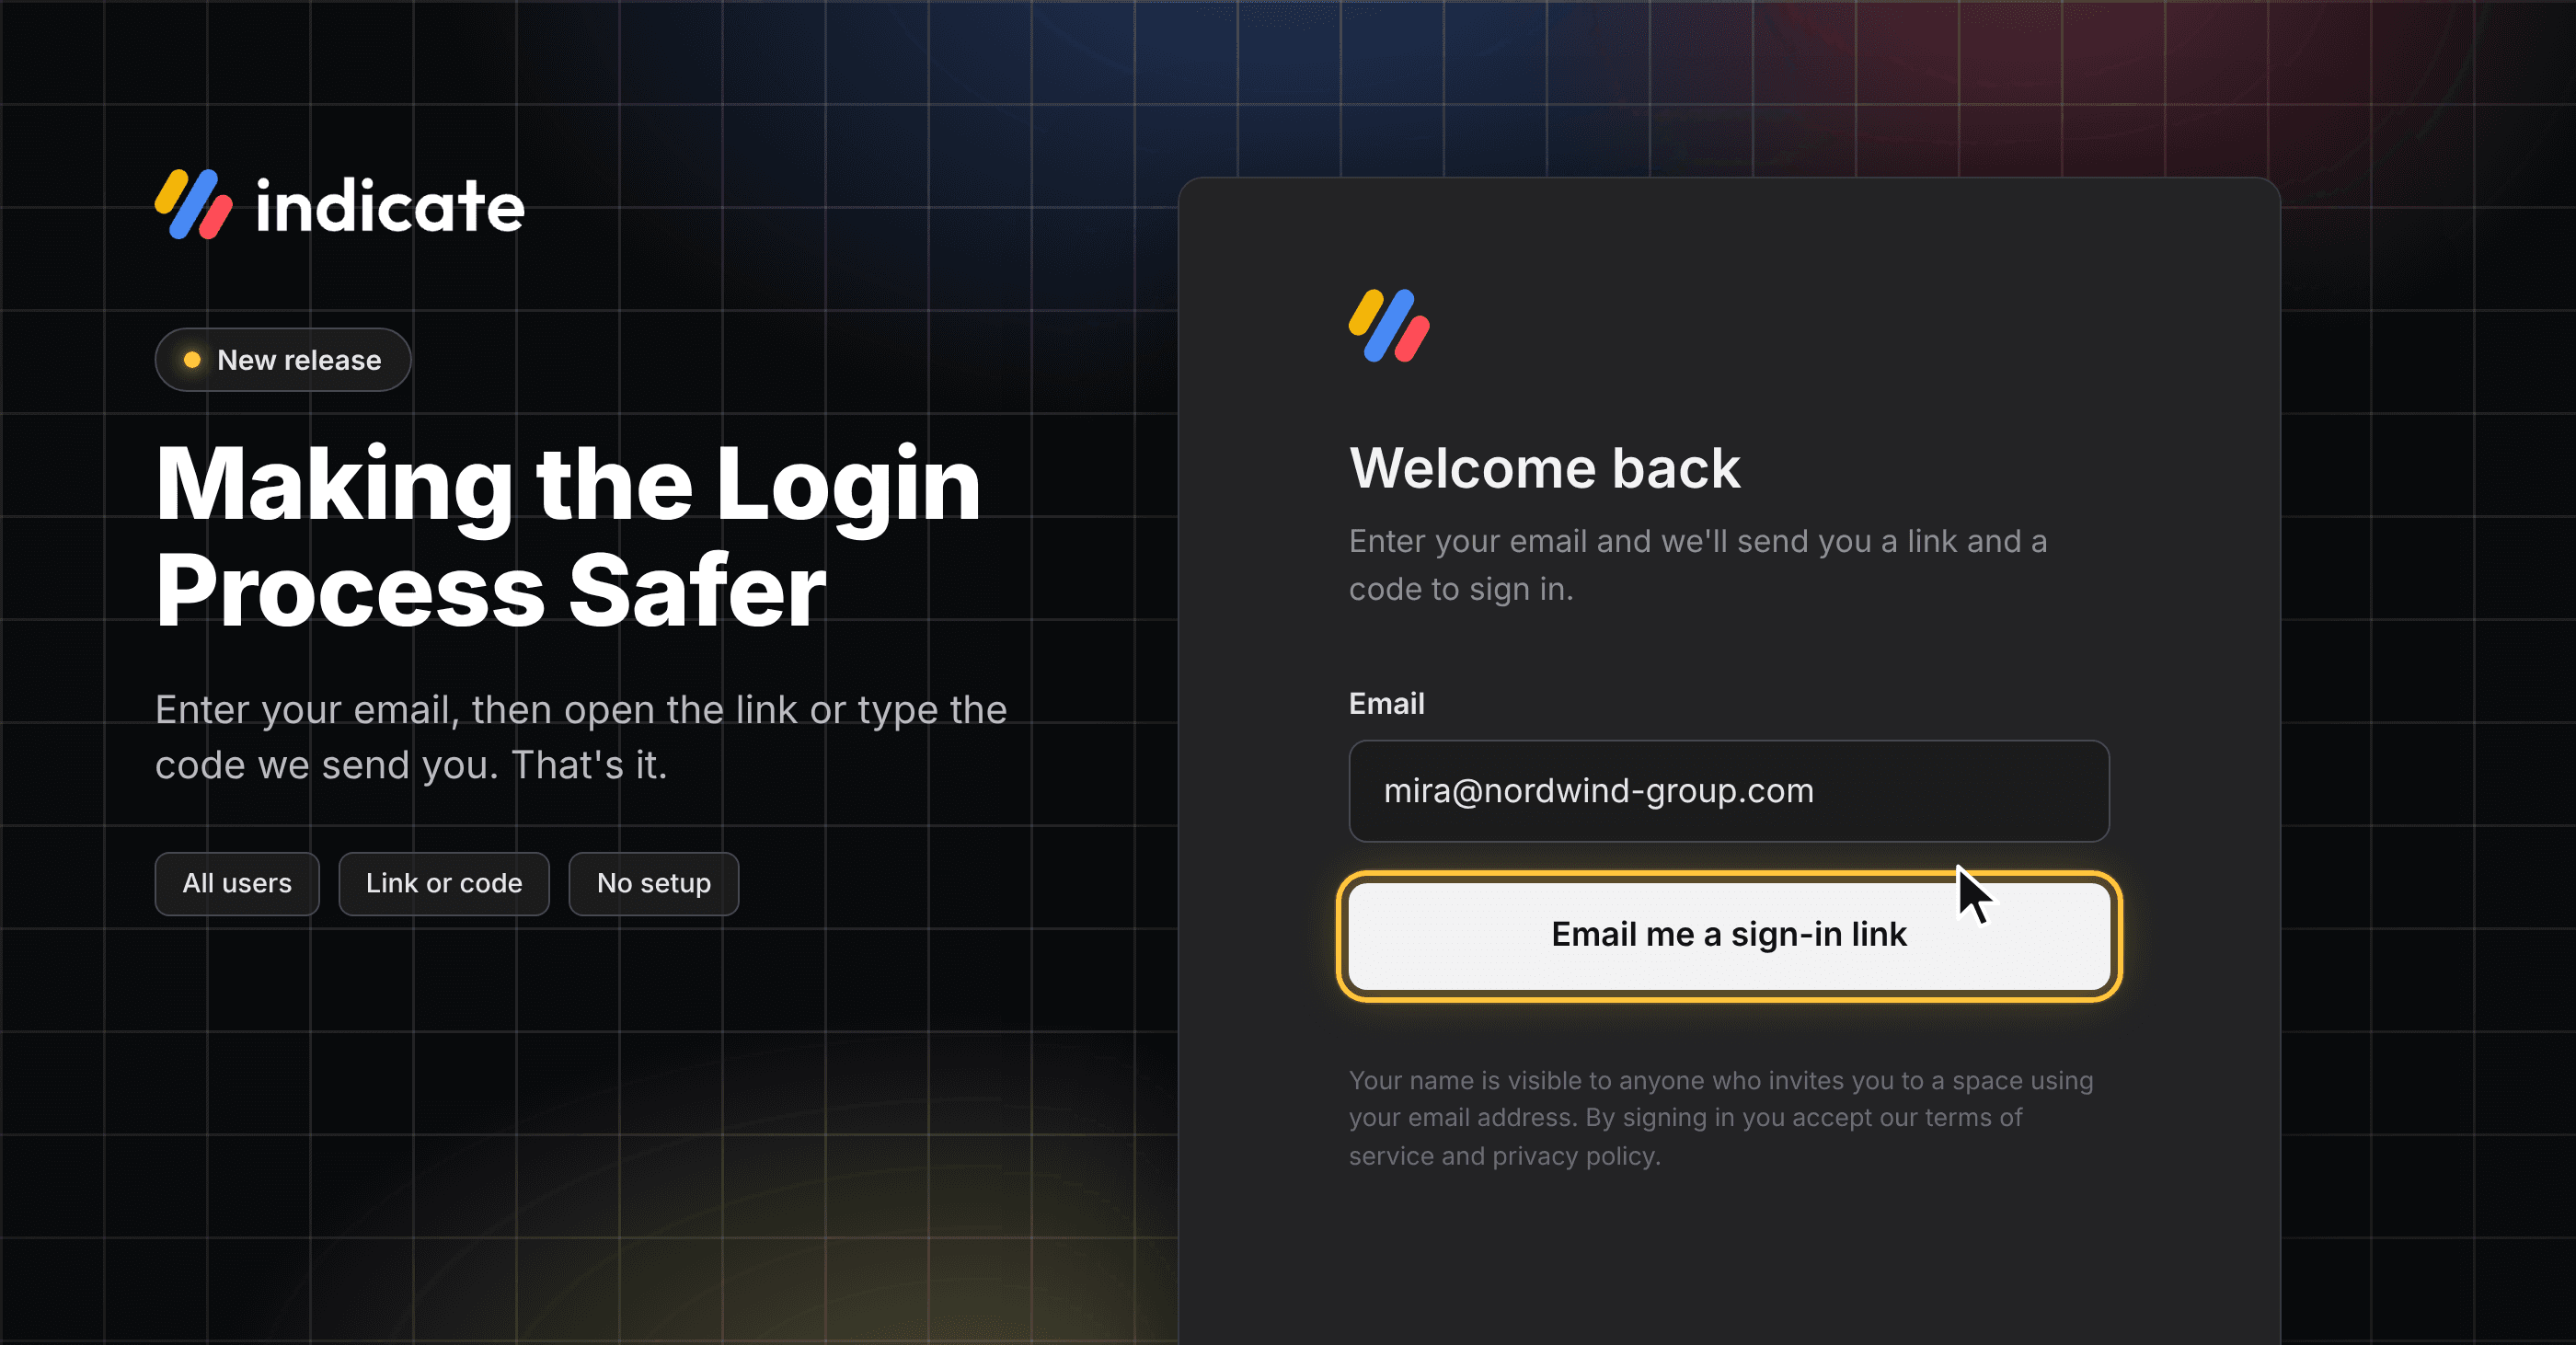
Bei Indicate hat der Schutz deiner Daten höchste Priorität. Damit dein Konto noch sicherer wird, haben wir die Anmeldung bei Indicate umgestellt: Passwörter gibt es nicht mehr.
Warum wir das machen
Viele nutzen dasselbe Passwort auf mehreren Seiten. Gleichzeitig macht KI es Angreifern immer leichter, Passwörter zu hacken oder zurückzusetzen und sich so unbefugten Zugang zu Systemen zu verschaffen. Ein gestohlenes Passwort soll kein Freifahrtschein für dein Konto sein.
Was sich ändert
Die Umstellung ist bereits live. Wenn du dich bei Indicate anmeldest, gibst du deine Mailadresse ein und du bekommst per Mail einen Link und einen Code zum Anmelden.
Wenn du Zwei-Faktor-Authentifizierung nutzt, gibst du nach dem Link oder Code aus der Mail deinen Authenticator-Code ein.
👉 Du musst nichts ändern. Die Anmeldeseite führt dich durch den neuen Ablauf:
Mailadresse eingeben,
Postfach öffnen,
auf den Link klicken, fertig.
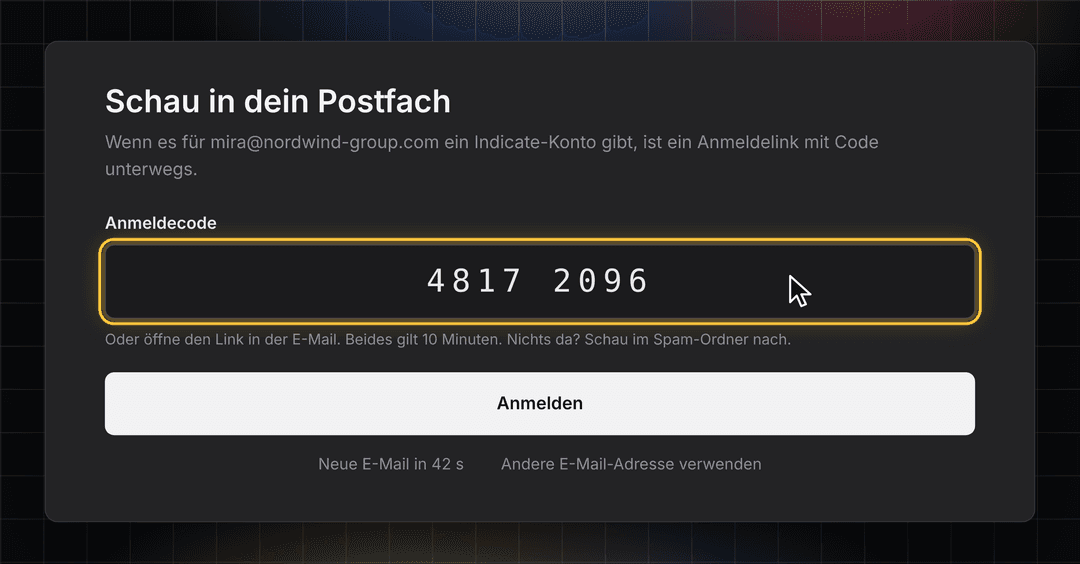
So funktioniert’s: Anmelden mit deiner Mailadresse
Nichts einzurichten: Alle bestehenden Konten sind umgestellt, und dein altes Passwort funktioniert nicht mehr.
Link oder Code, du entscheidest: Öffne den Link am Laptop oder tippe den Code aus der Mail ein.
Sicher von Anfang an: Jeder Link und jeder Code gilt nur einmal und zehn Minuten lang. Es zählt nur die neueste Mail.
Ein Klick weniger: Öffnest du den Link in dem Browser, in dem du ihn angefordert hast, bist du sofort angemeldet.
Zwei-Faktor-Authentifizierung bleibt: Wenn du die Zwei-Faktor-Authentifizierung nutzt (was wir empfehlen), bestätigst du nach dem Link oder Code weiterhin mit deiner Authenticator-App.
👉 Du siehst den neuen Login-Prozess bei deiner nächsten Anmeldung auf app.indicate-data.com. Mehr Infos findest du hier.
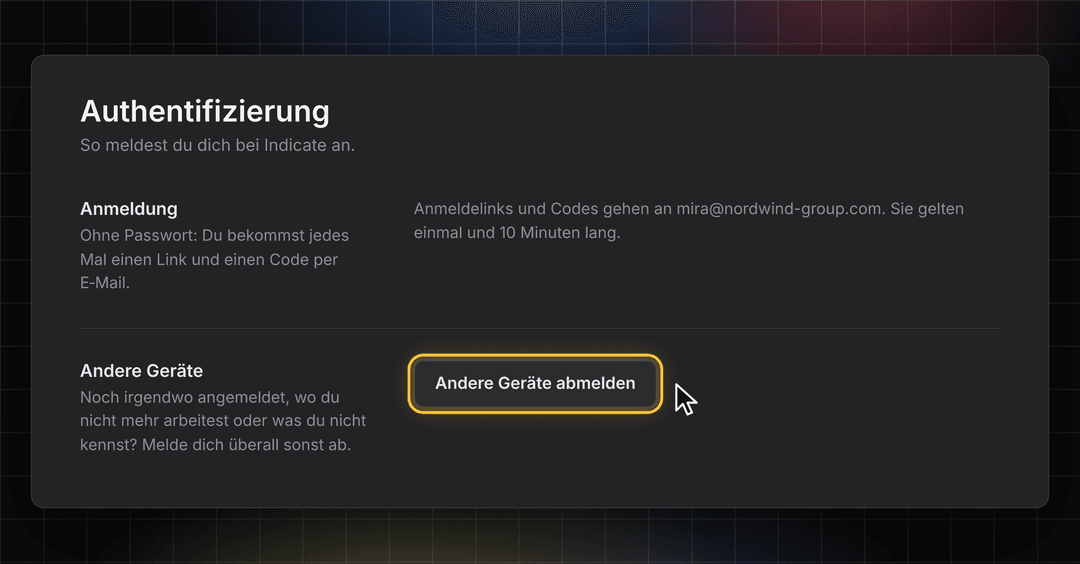
Andere Geräte: Überall abmelden
Noch am PC an der Rezeption angemeldet, den du nicht mehr nutzt? Melde mit einem Klick alle anderen Geräte ab. Das Gerät, an dem du gerade arbeitest, bleibt angemeldet.
👉 Du findest das unter Einstellungen → Konto → Authentifizierung. Mehr Infos findest du hier.
Bleib auf dem Laufenden
Wir bauen Indicate gemeinsam mit dir und erweitern unsere Features laufend. Schau jederzeit in unseren Changelog und folge uns auf LinkedIn, um als Erstes zu erfahren, was neu ist.
Fragen, Ideen oder Feedback? Wir freuen uns, von dir zu hören, also schreib uns einfach.
Dein Indicate Team
Download Dashboards as PDFs, Flying KPI Editor and Connect Invites
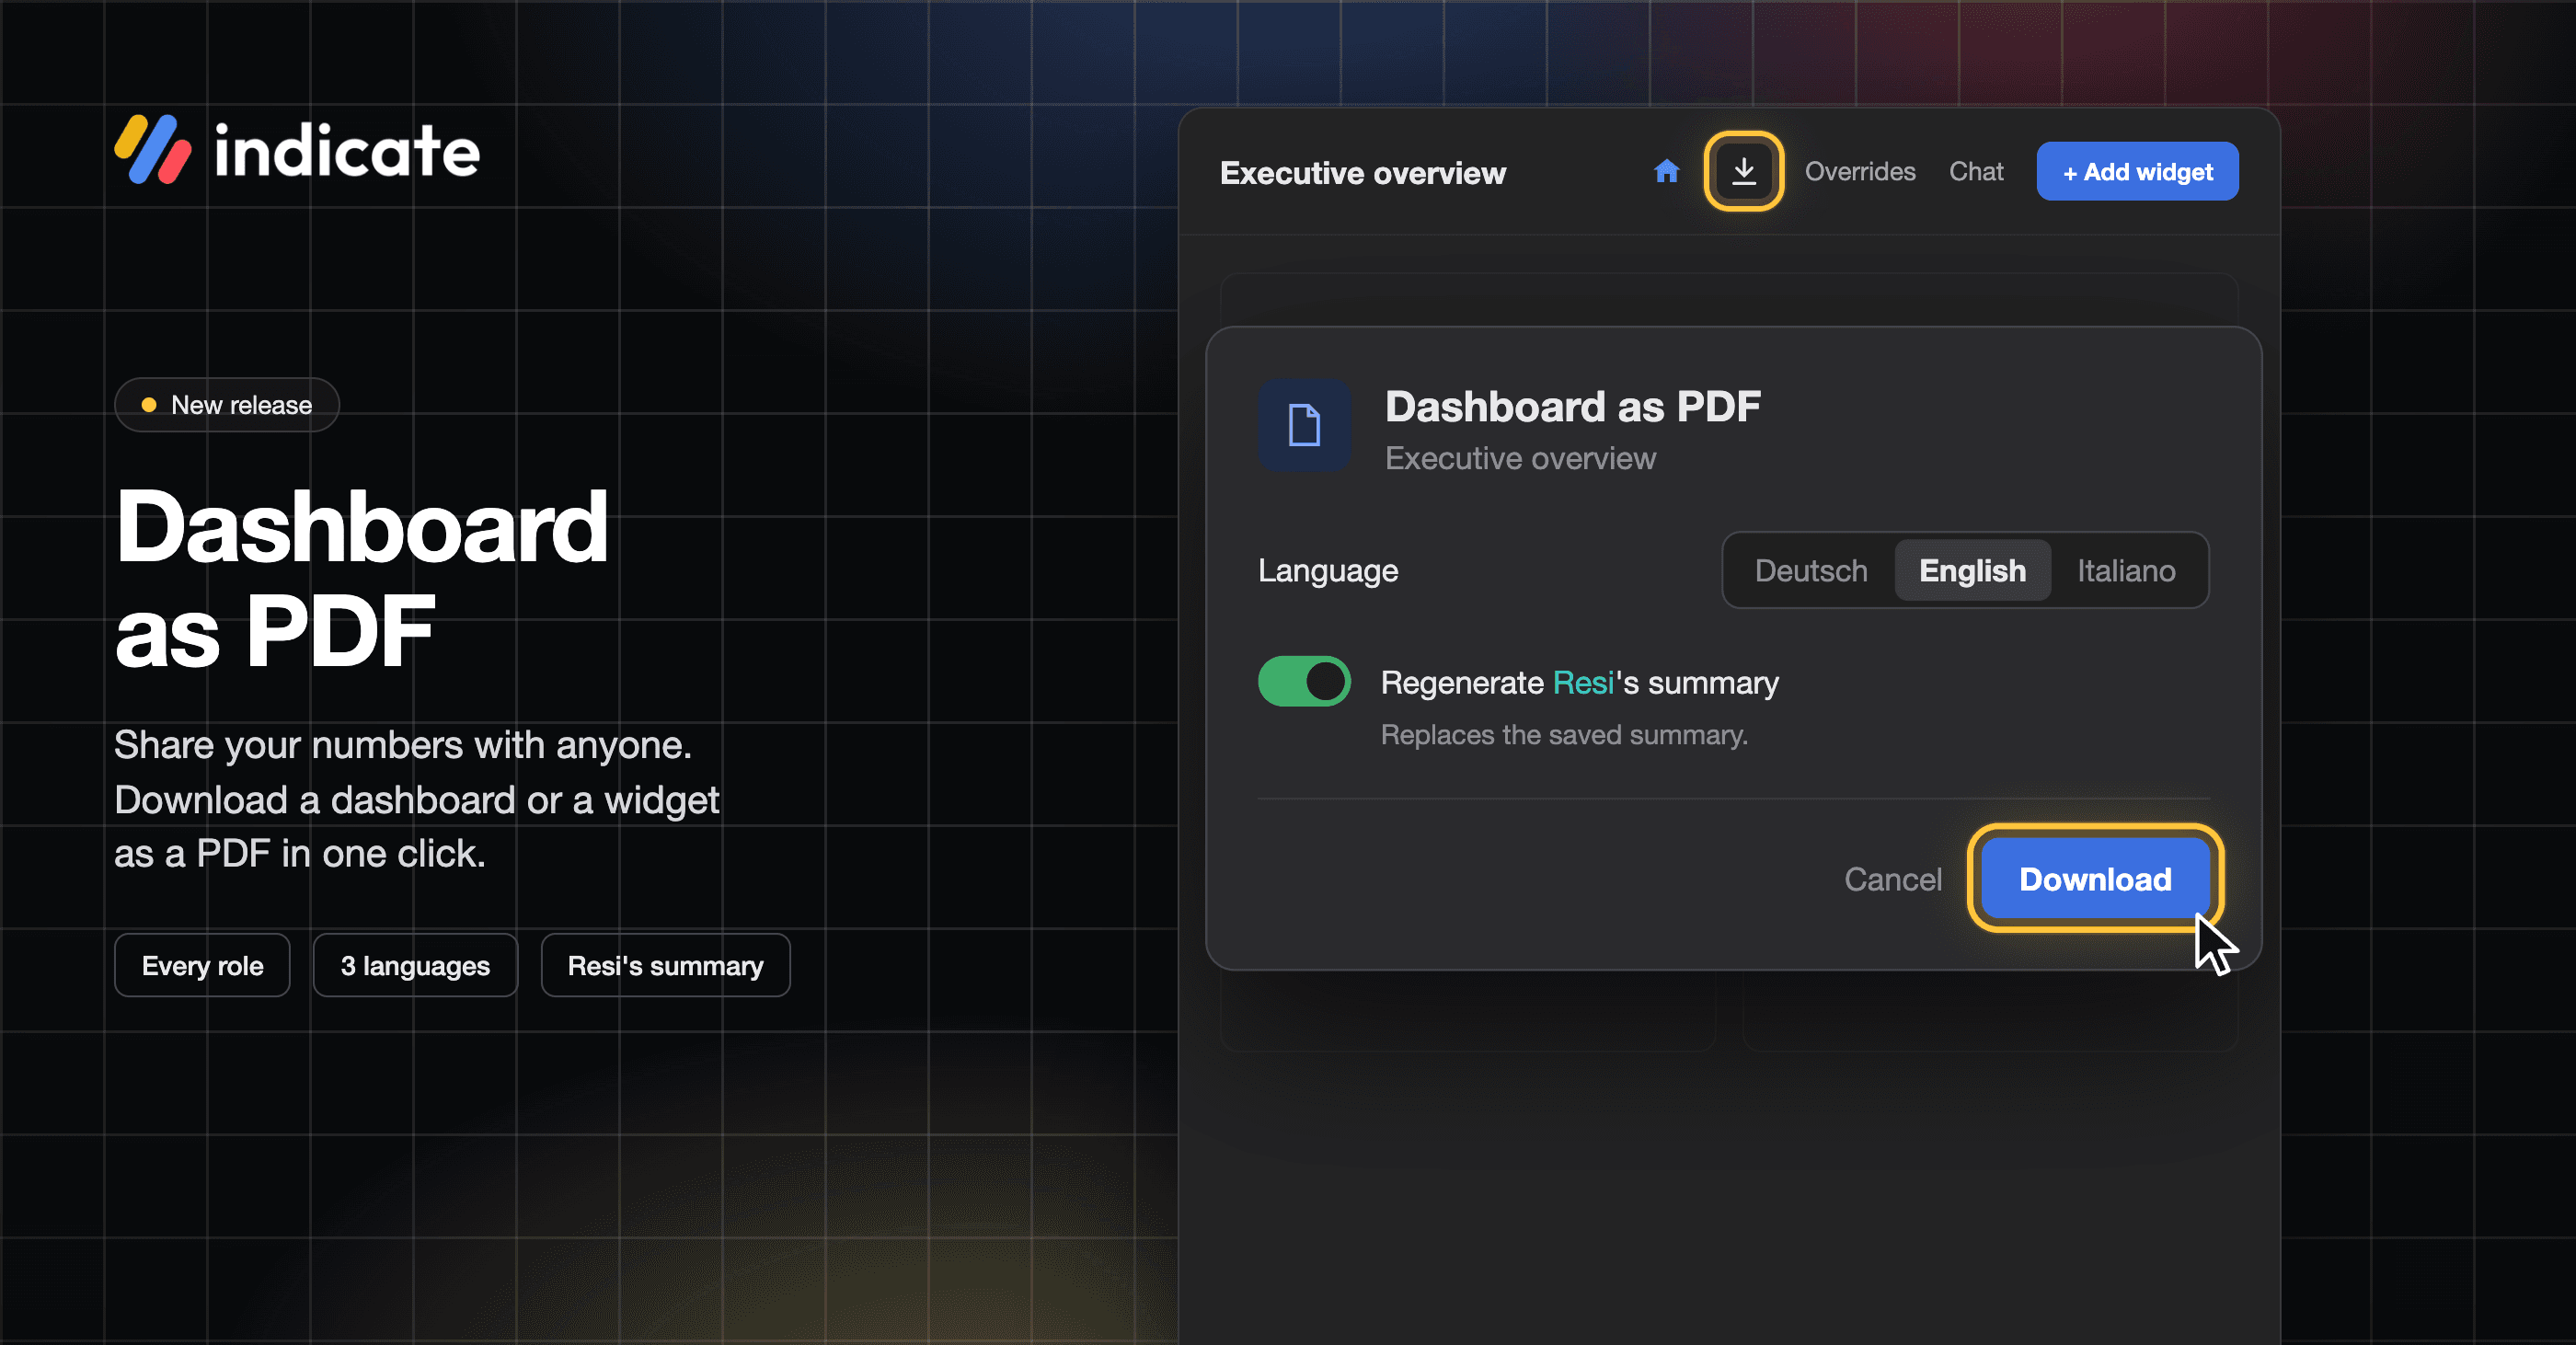
Download Dashboards as PDF: Share Your Numbers With Anyone
Download any dashboard as a PDF and send it to people, for example, the owner of a hotel, your marketing team, or your front desk.
Pick the language: German, English, or Italian. The PDF and Resi's summary are written in that language.
Add Resi's summary on top: generating an AI summary works for members with AI access and uses your AI budget.
Easier to read: tables show the icon and name of each data source, and wide tables are split into parts. Widgets with a ranking show the Top N hint, as in the app.
👉 You can find this in Analytics → your dashboard → Download as PDF, the download icon in the toolbar, or the three-dot menu. Find more information here.
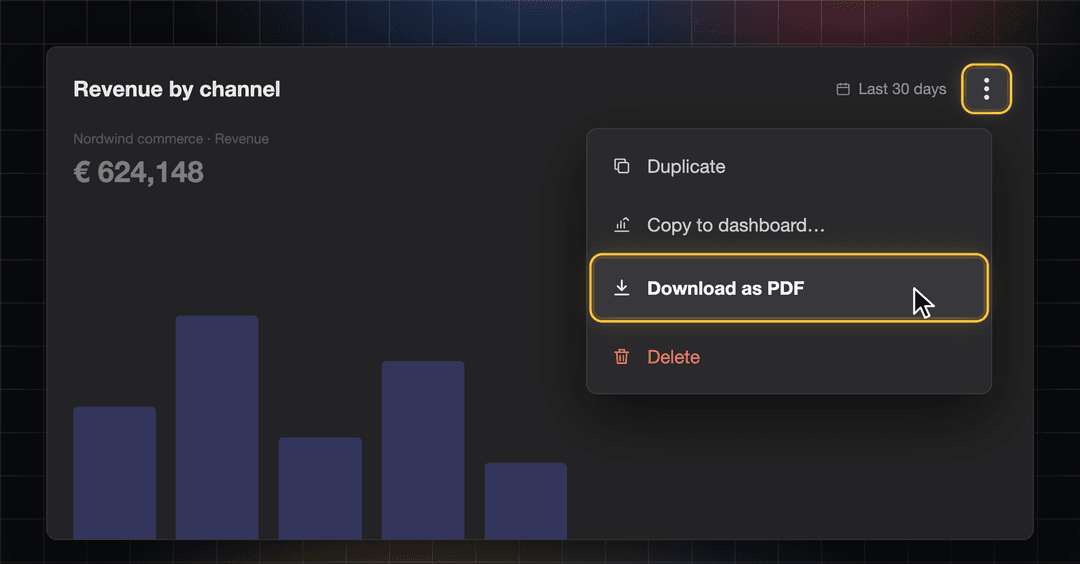
Download Widget PDFs: Just the Chart You Need
Need only one number for a meeting? Download a single widget as a PDF, without a dialog. It comes out with the time range and grain you see on the dashboard.
👉 You can find this in the three-dot menu of a widget → Download as PDF. Find more information here.
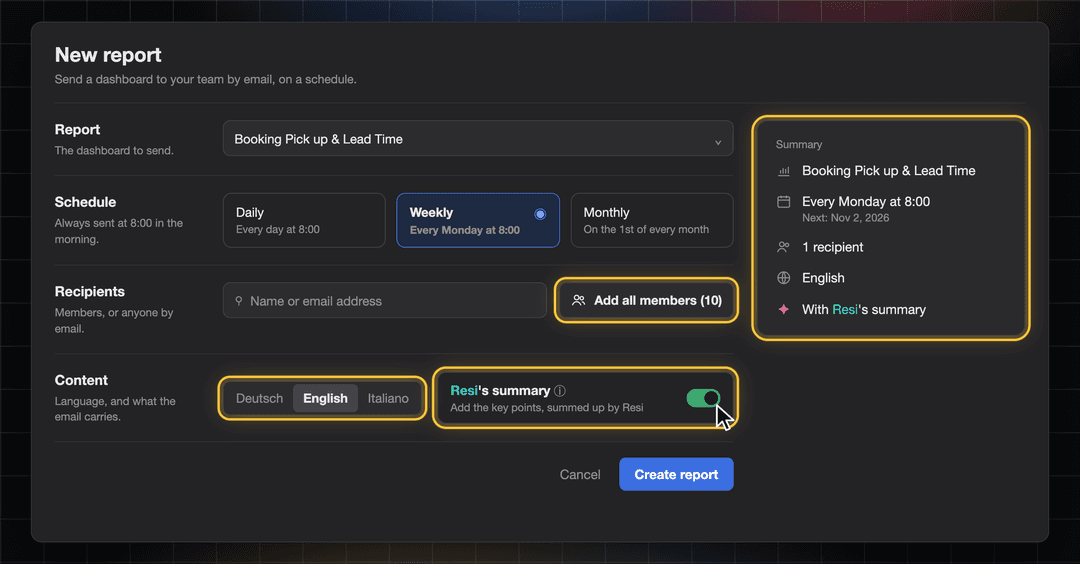
Flying KPIs: Set Up and Keep Track of Every Report
You now create and edit a Flying KPI on its own page instead of a small dialog. Report, schedule, recipients, and content sit in clear sections, with a summary of the report on the right. We added some new features too:
Choose the language of each report: German, English, or Italian.
Add recipients faster: add all members at once, or paste several email addresses in one go.
Find reports quickly: search by report, dashboard or recipient, and filter by Active or Paused.
See when a report last went out in the new Last sent column.
See which reports include Resi's summary. It is now on by default for new reports and uses your AI budget.
Recipients can unsubscribe with one click from every email.
👉 You can find this in Flying KPI, the rocket icon in the left rail. Find more information here.
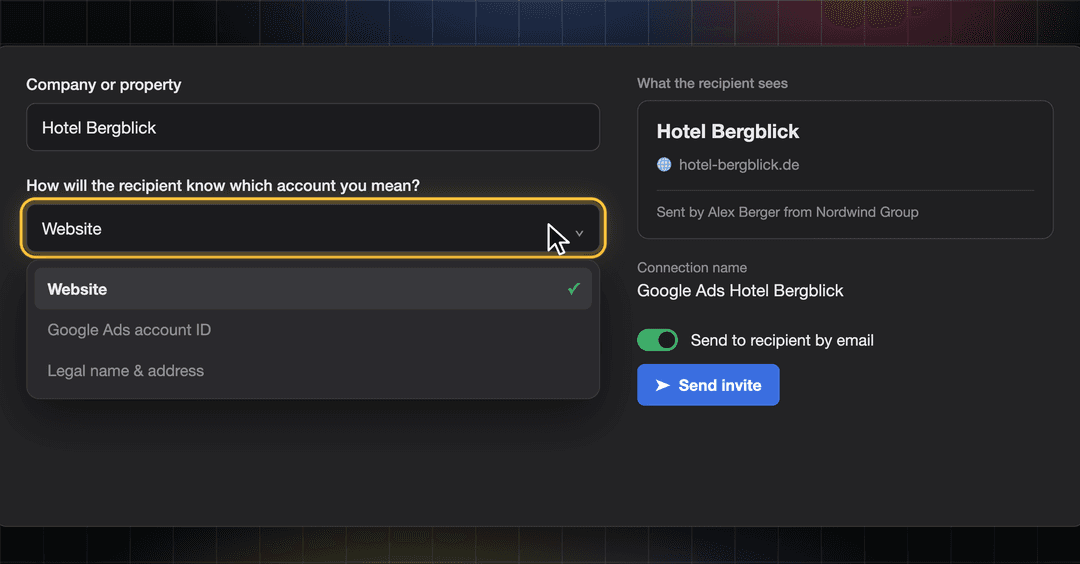
Connect Invites: The Right Person Connects the Right Account
A connect link lets someone outside Indicate connect a data source for you, for example, the agency that runs your Google Ads or a colleague who has the login. Creating an invite link to connect a data source now happens on its own page that also works on your phone.
Say who it is for: enter the company or property, for example, Hotel Bergblick.
Tell their account apart: pick the website, the account ID, or the legal name and address, so the recipient knows which account you mean.
See what the recipient sees: a preview card shows the company, the detail you picked, and who sent the invite.
Send it by email: switch on Send to recipient by email, and we deliver the link. Or copy it and share it yourself.
Resend an invite from the invites list if the first email got lost. Invited before suggests recipients you used earlier.
👉 You can find this in Data sources → Marketplace → select your integration → Generate connect link. Your invites are in Data sources → Connect invites. Only space admins can create connect links. Find more information here.
Stay in the Loop
We're building Indicate with you, and there's always more on the way. Take a look at our changelog anytime and join us on LinkedIn to be the first to hear what's new.
Questions, ideas, or feedback? We'd love to hear from you, so just get in touch.
The Indicate Team
Flying KPIs New Design
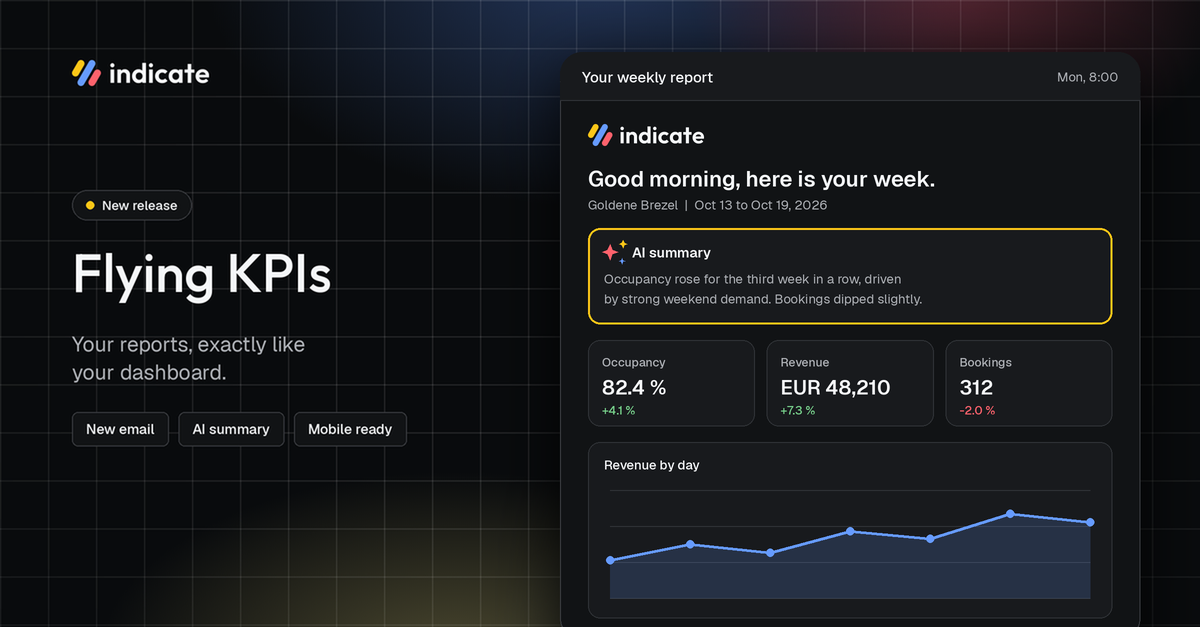
New Flying KPIs: Your Reports in Your Inbox
Flying KPIs send a dashboard by email on a schedule: daily, weekly or monthly. Your team gets the numbers in their inbox, for example, a Monday morning report on occupancy and revenue for the management team. Recipients can be members of your space or any email address.
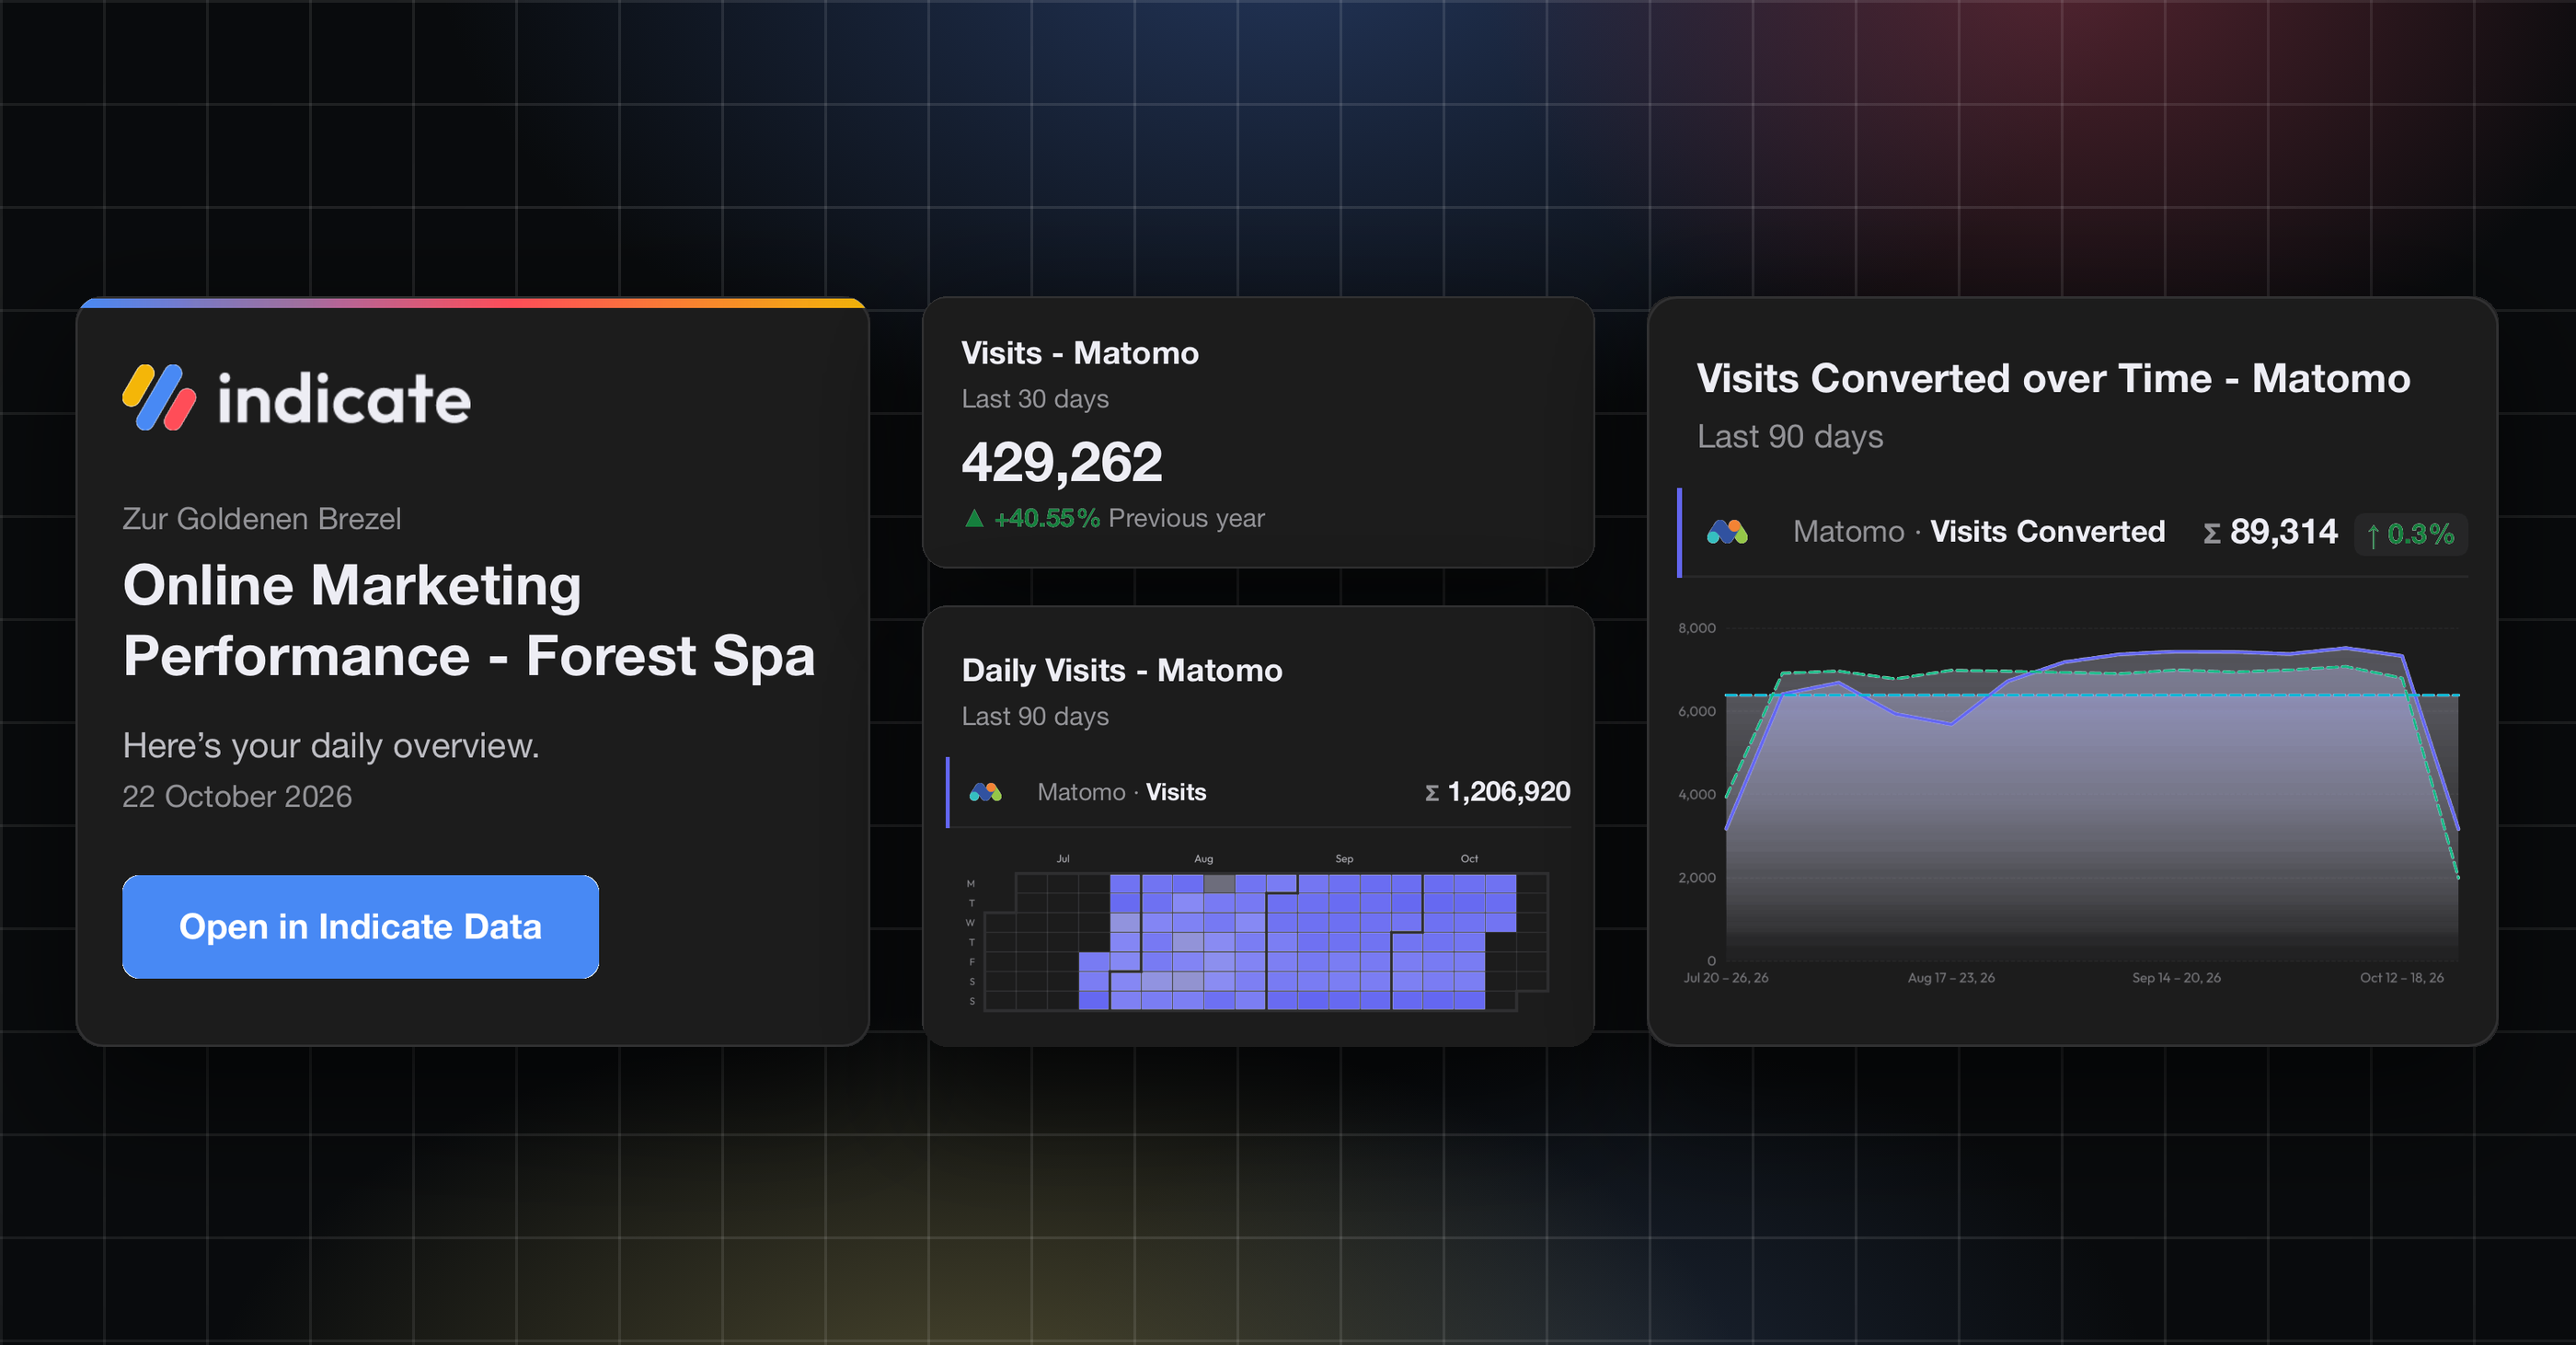
A New Look for Your Flying KPI Reports
Your scheduled Flying KPI reports now come in a completely new email design:
Same look as the dashboard: KPI names, colors, values and filters match your widgets.
Resi’s AI summary first (optional): Resi’s summary sits at the top and is created like the AI summary on your dashboard. It uses your AI budget. If the budget is used up, the report still goes out without it.
Made for email: one column that works on desktop and mobile with a link to the dashboard.
👉 All existing reports switch automatically, so you don’t need to change anything.
👉 You can find this in Flying KPI, the rocket icon in the left rail. Find more information here.
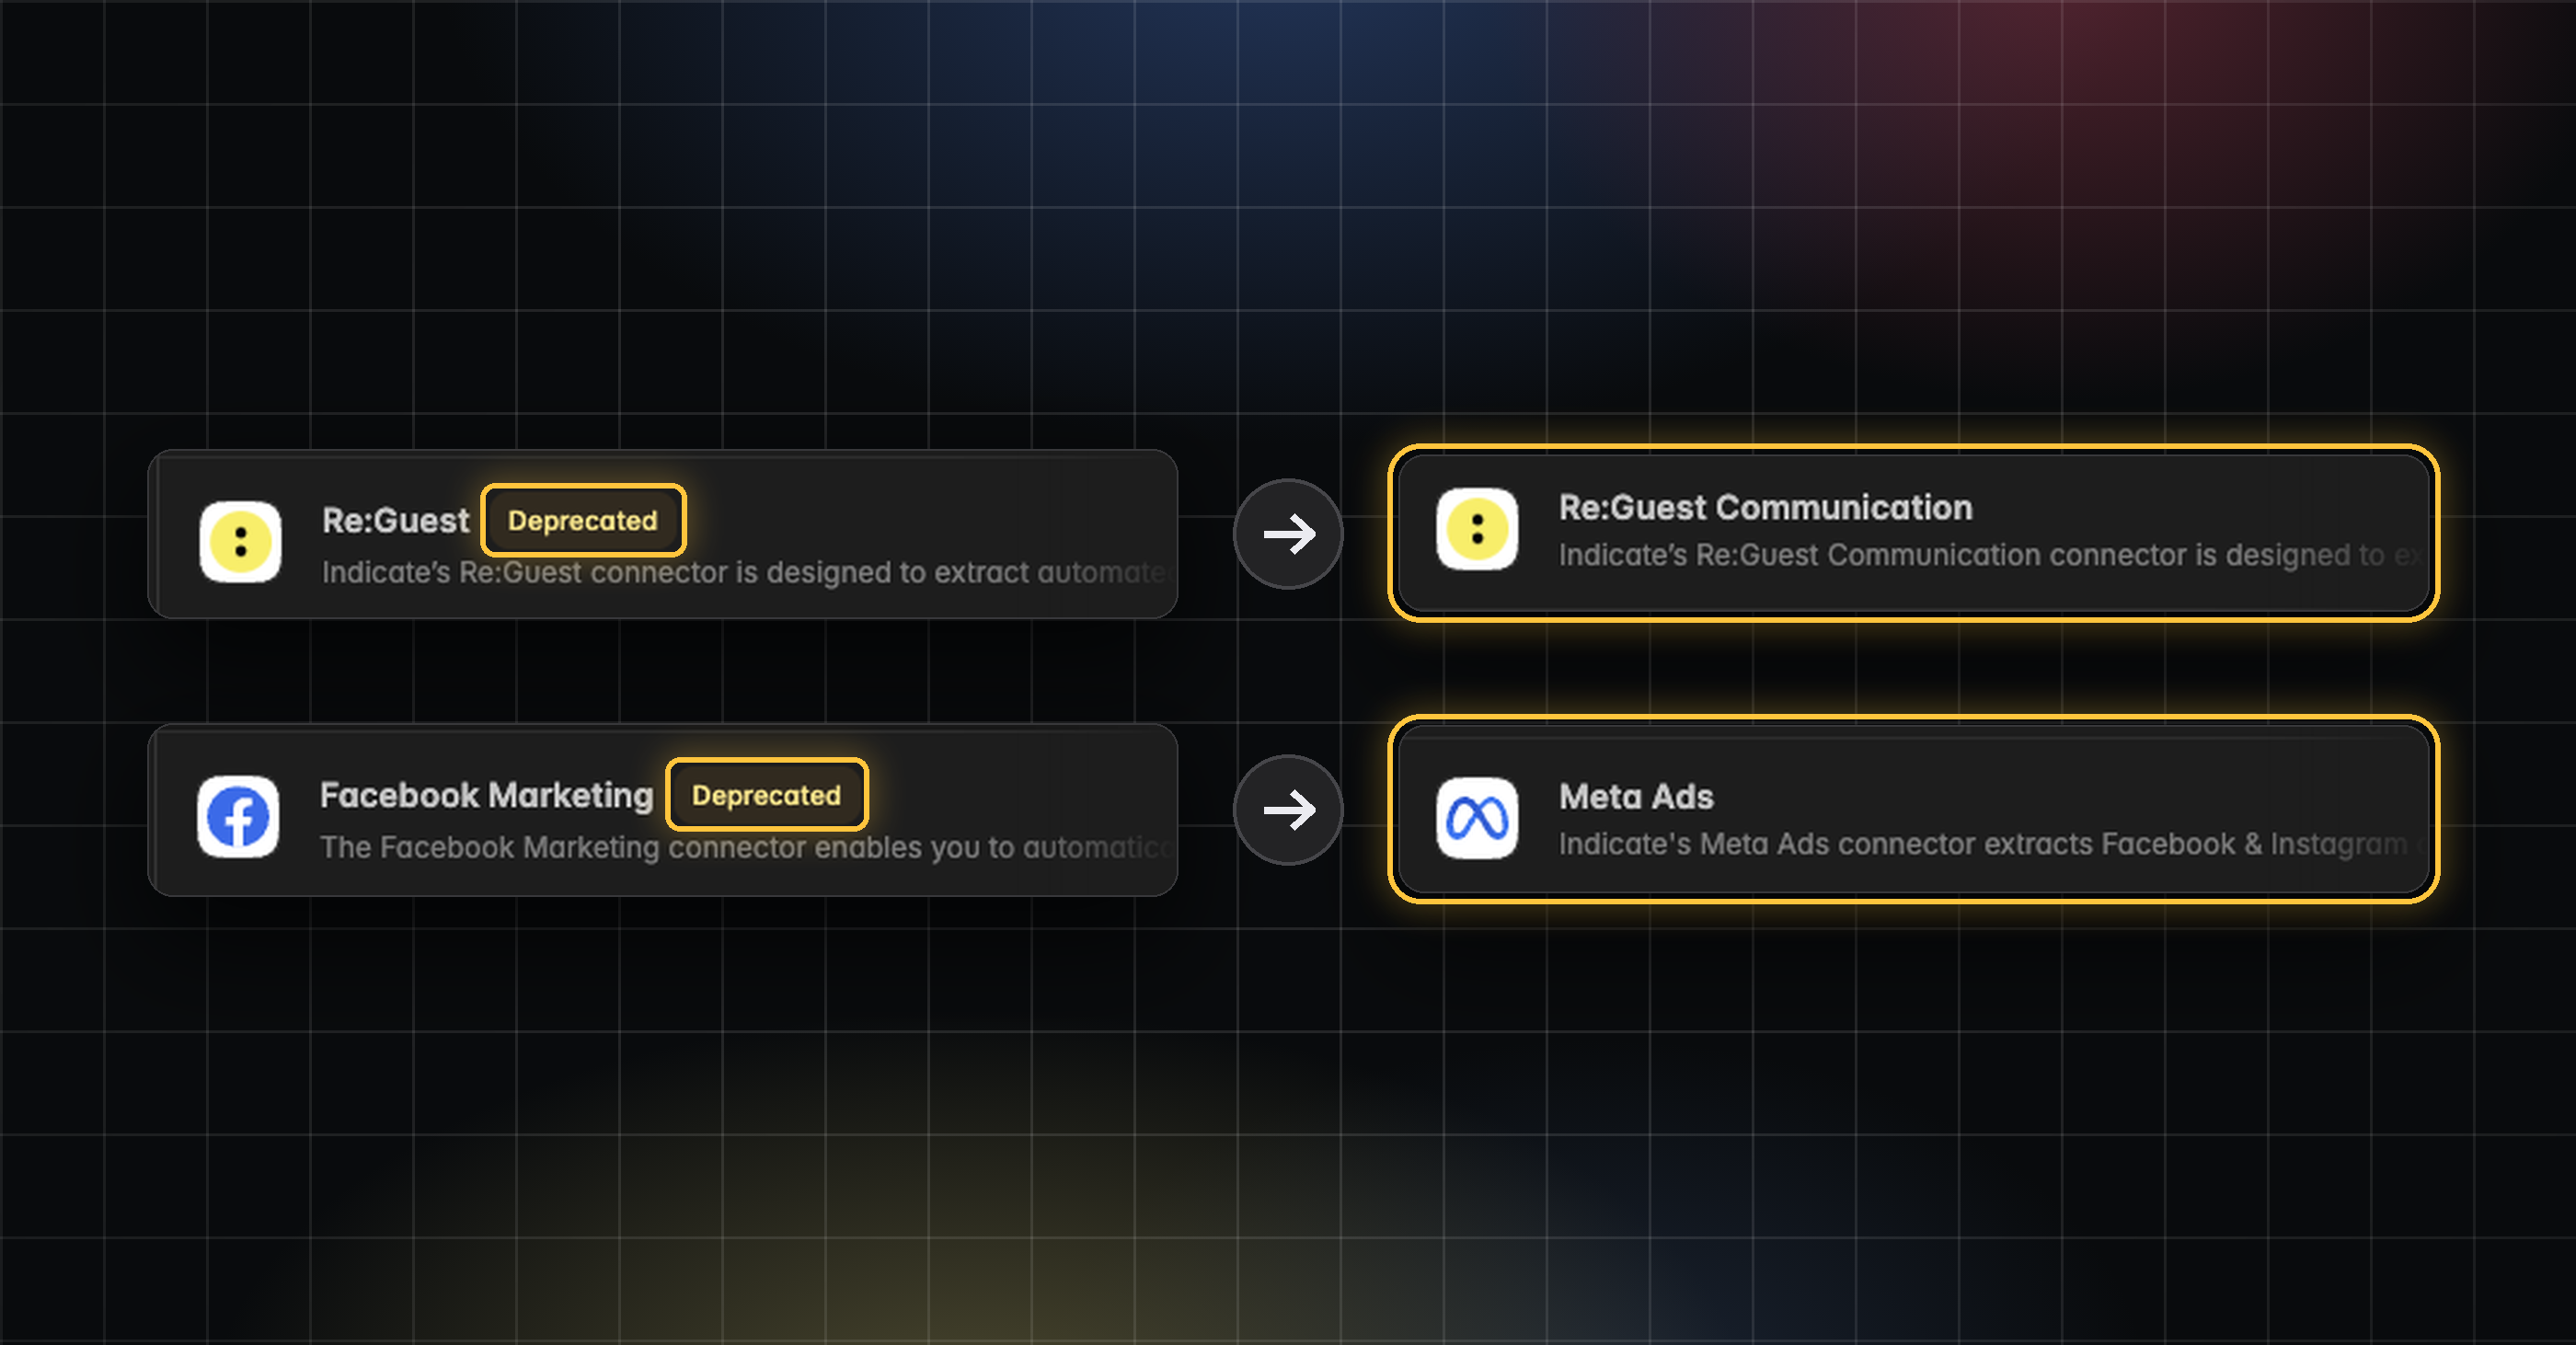
Reminder: Re:Guest API and Facebook Marketing API: Switched Off on November 1
On November 1, 2026, the Re:Guest and Facebook Marketing connectors are discontinued. Their pipelines stop and no new data comes in. Your historical data stays available, so past numbers in your dashboards don’t disappear.
Connect the new connectors before November 1: Re:Guest Communication replaces Re:Guest, and Meta Ads replaces Facebook Marketing
Then swap the widgets on your dashboards to the new data sources. This includes your Flying KPI reports, because they send the same widgets as your dashboards.
Resi works with the new connectors right away. You can also choose which data source she uses when she builds or changes a dashboard.
Widgets that still use an old connector show a warning icon in their top right corner. Hover over it to see which connection is affected.
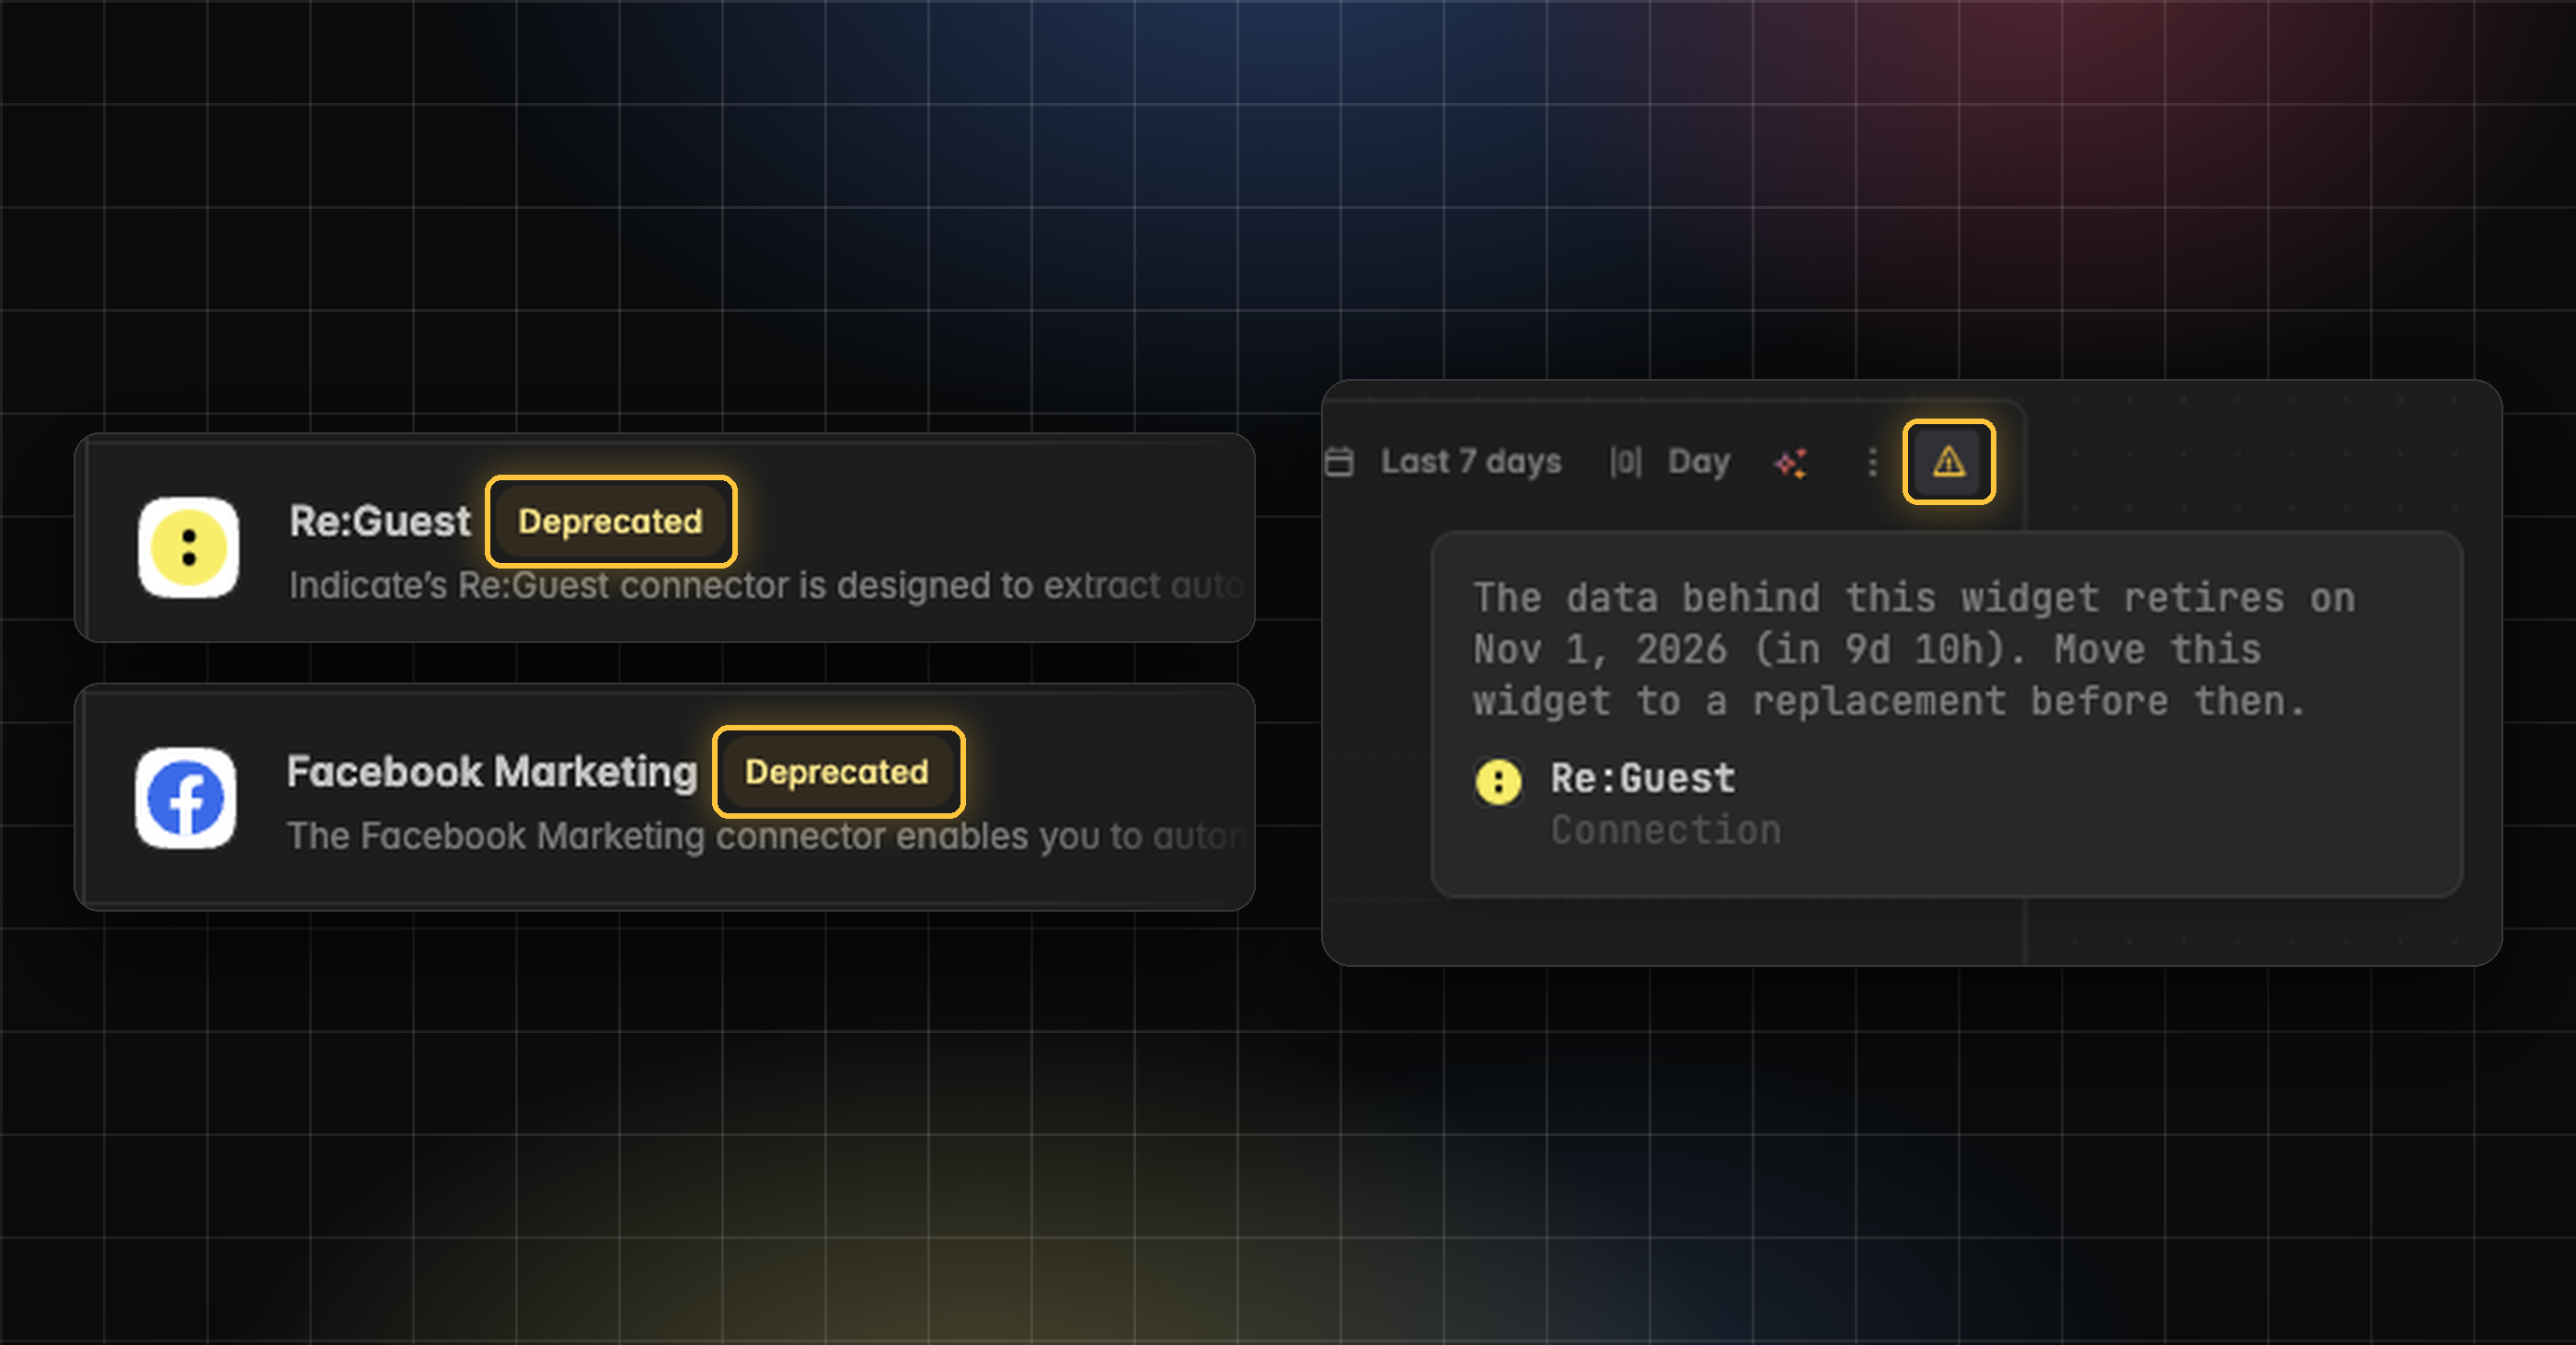
Old connectors are marked Deprecated in the Marketplace and take no new connections.
👉 You can find the new connectors in Data Sources → Marketplace. Find more information here.
Stay in the Loop
We're building Indicate with you, and there's always more on the way. Take a look at our changelog anytime and join us on LinkedIn to be the first to hear what's new.
Questions, ideas, or feedback? We'd love to hear from you, so just get in touch.
The Indicate Team
Add Members to Many Spaces at Once
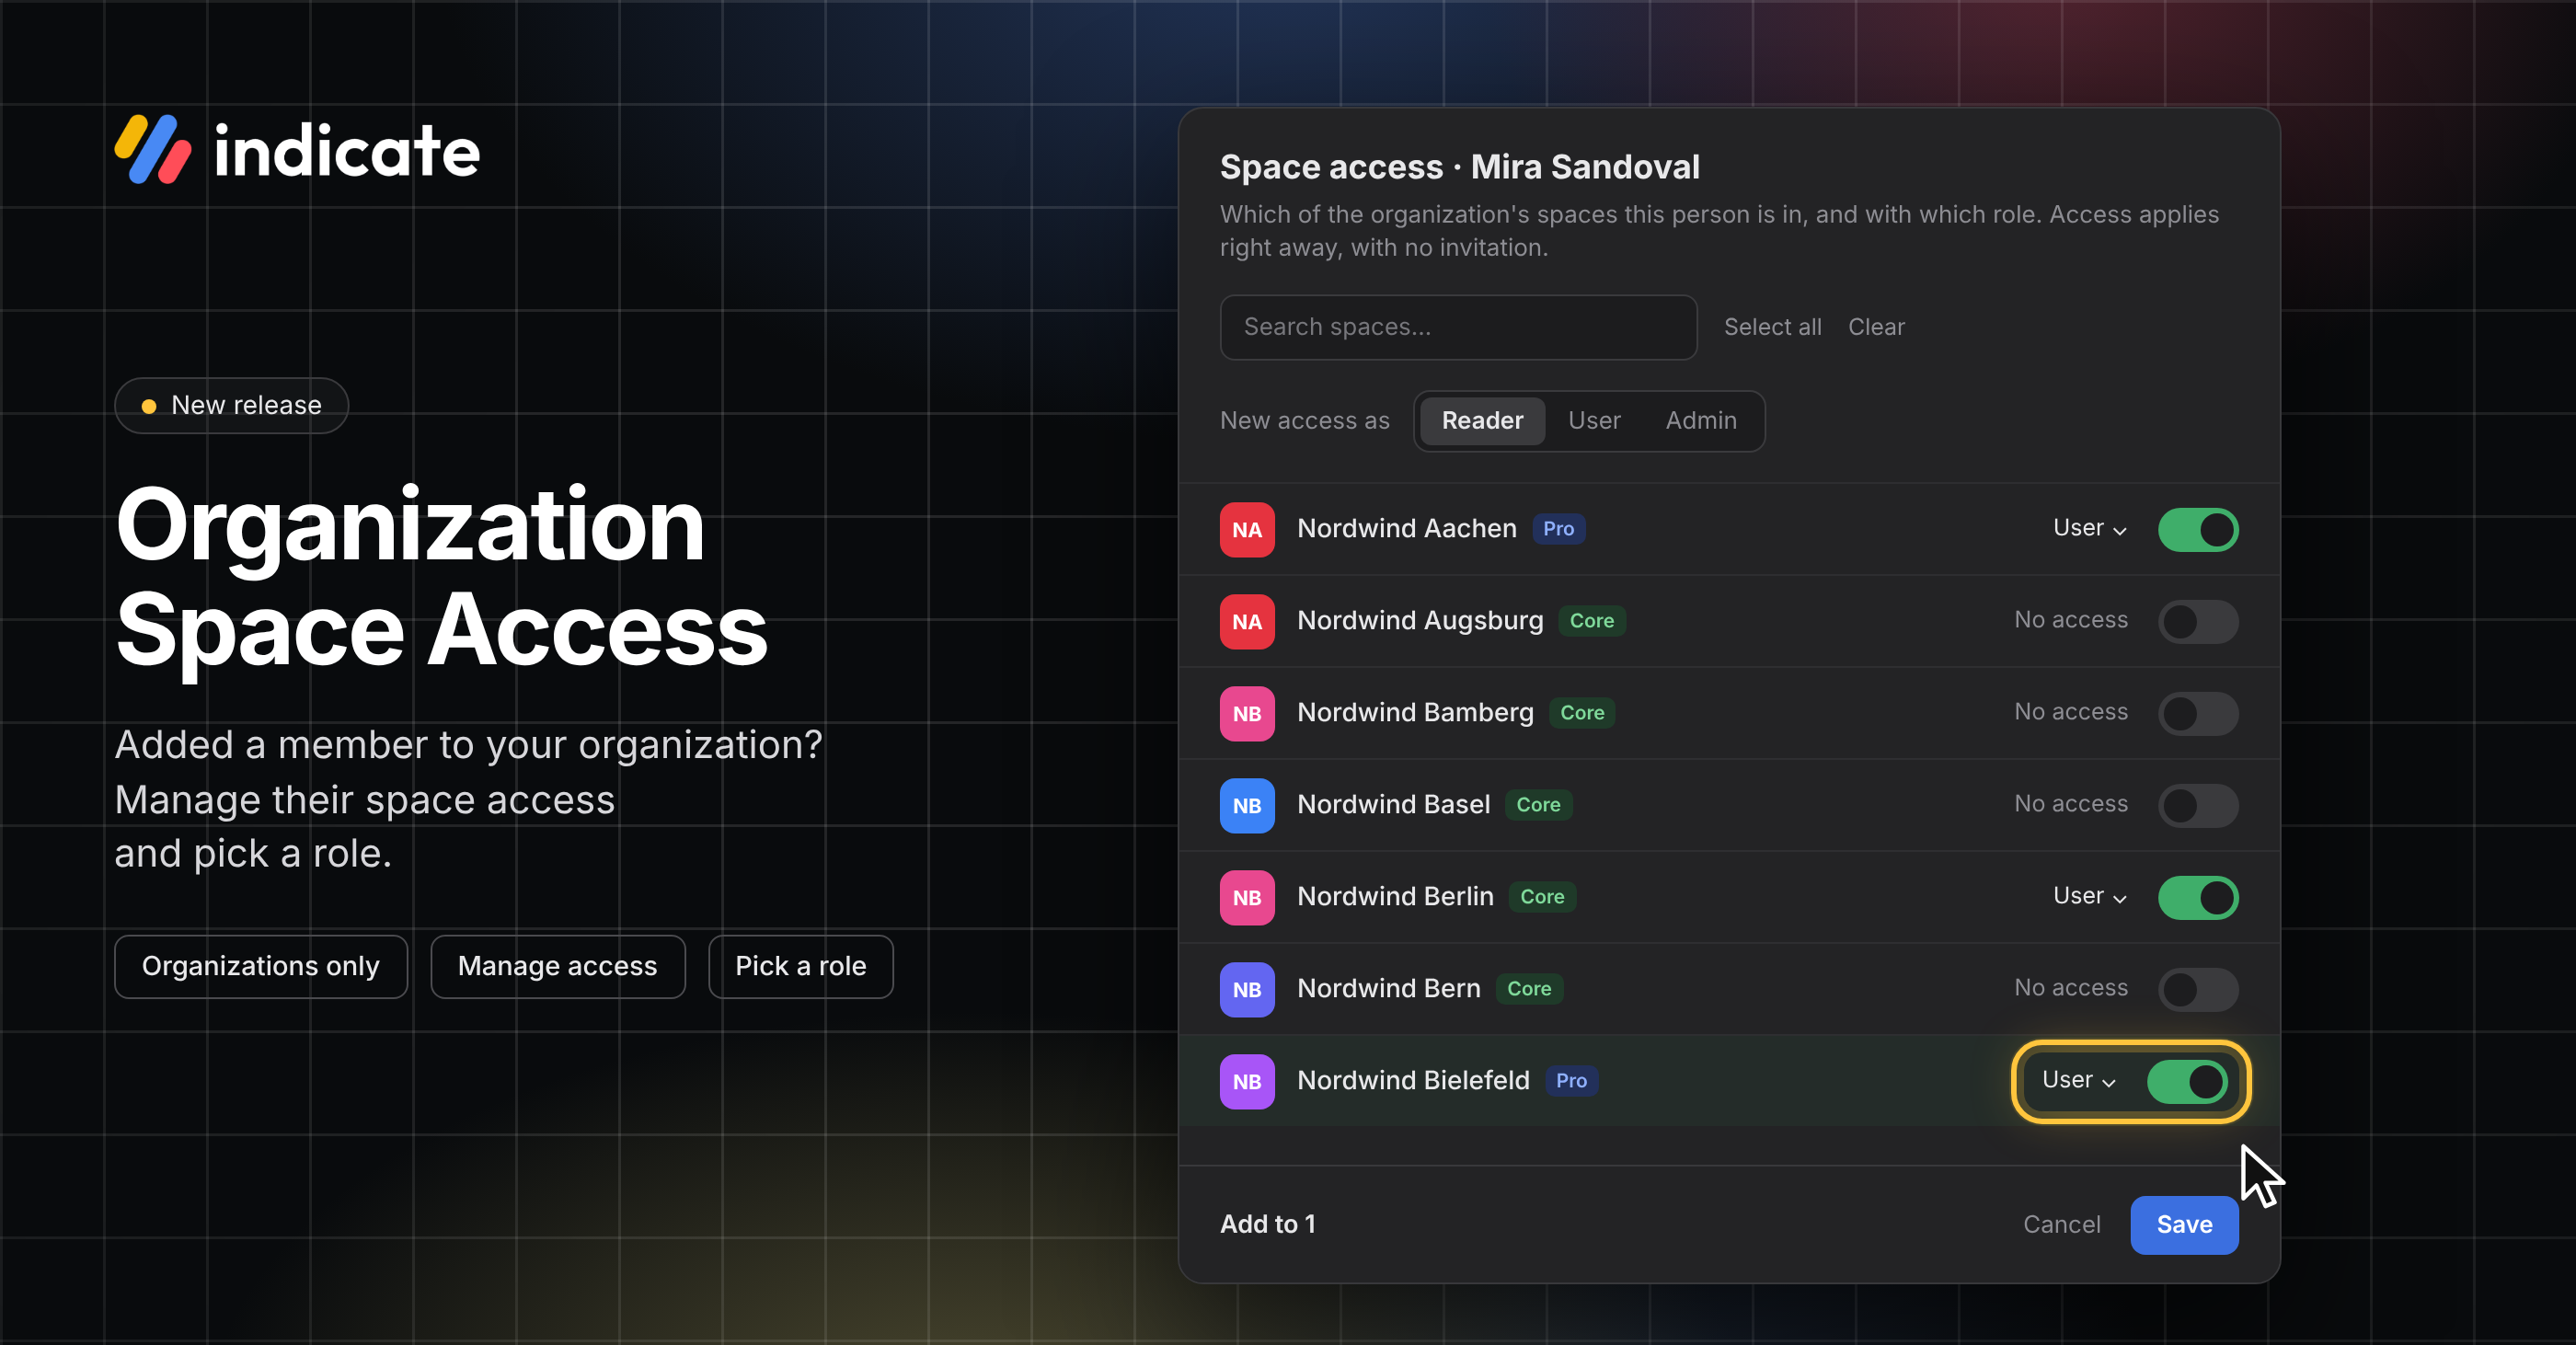
Organization Space Access: Add Members to Many Spaces at Once
Managing space access is a new feature for organizations in Indicate. An organization can be an agency, a hotel chain, or anyone who works with several spaces. Once someone is a member of your organization, as a space Admin, you can manage their role and their access to all of your organization's spaces from one dialog. There is no invitation and no accept step: the person has access to the spaces as soon as you save.
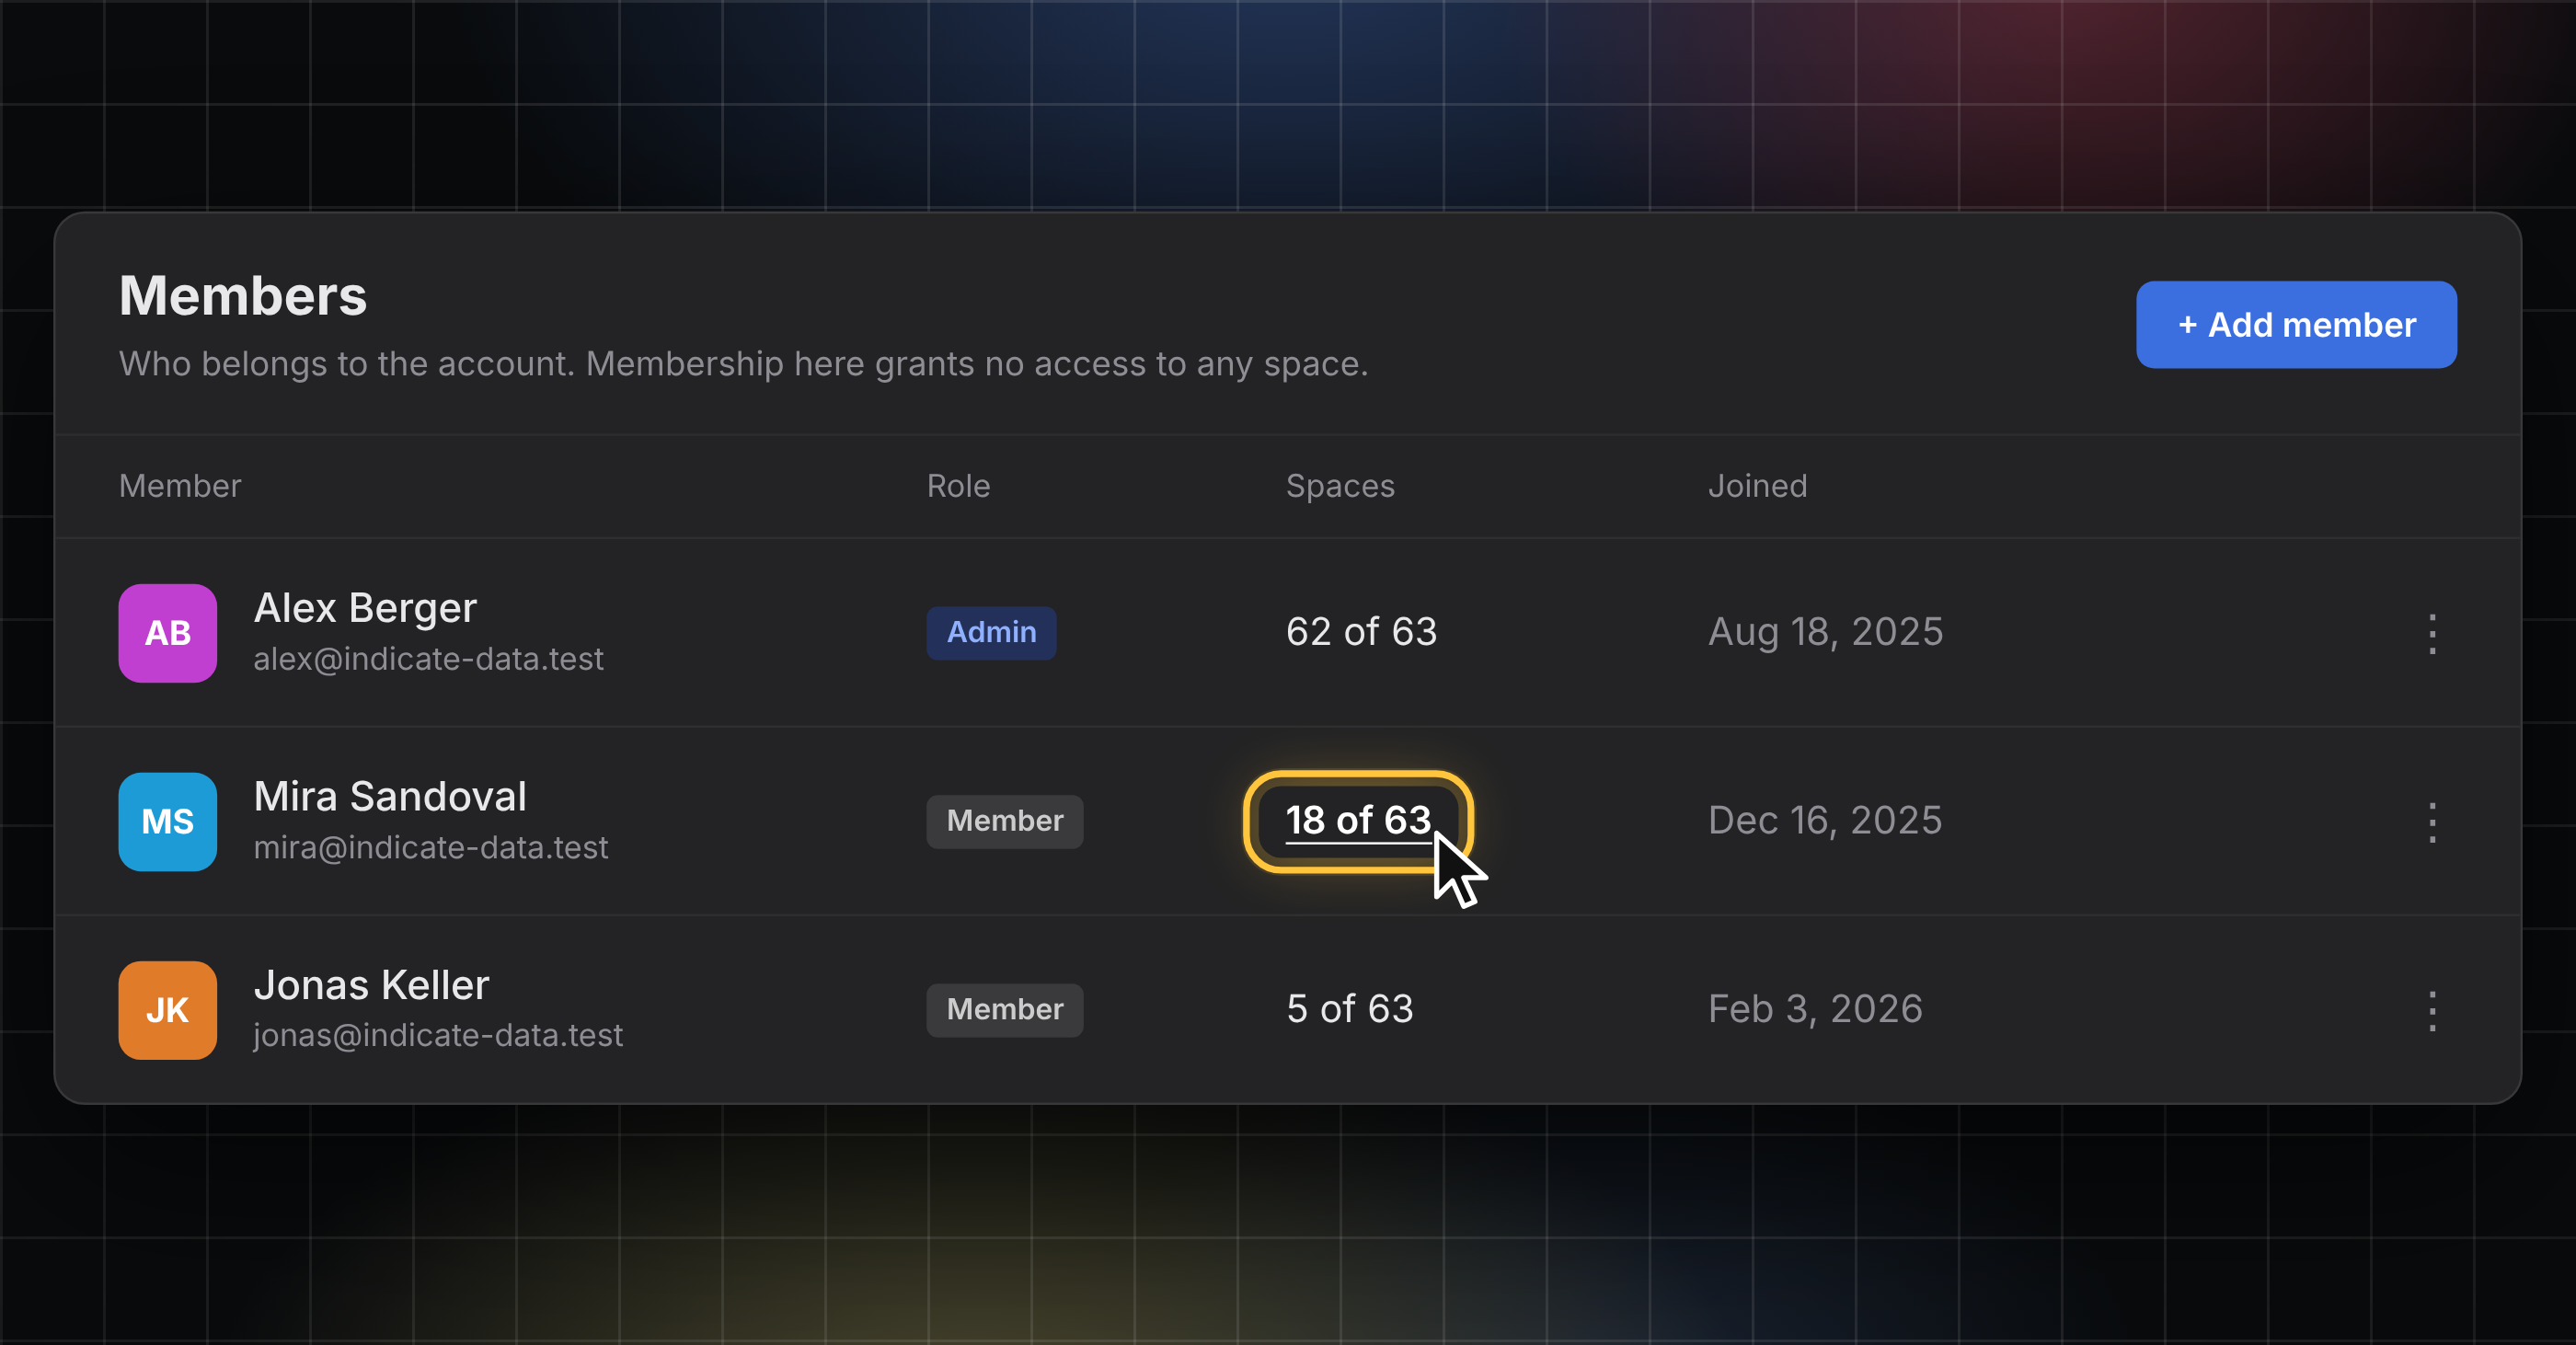
See how many spaces a member is in
The new Spaces column shows how many of your organization's spaces each member is in, for example, "18 of 63". Click the count to see the spaces the member is part of.
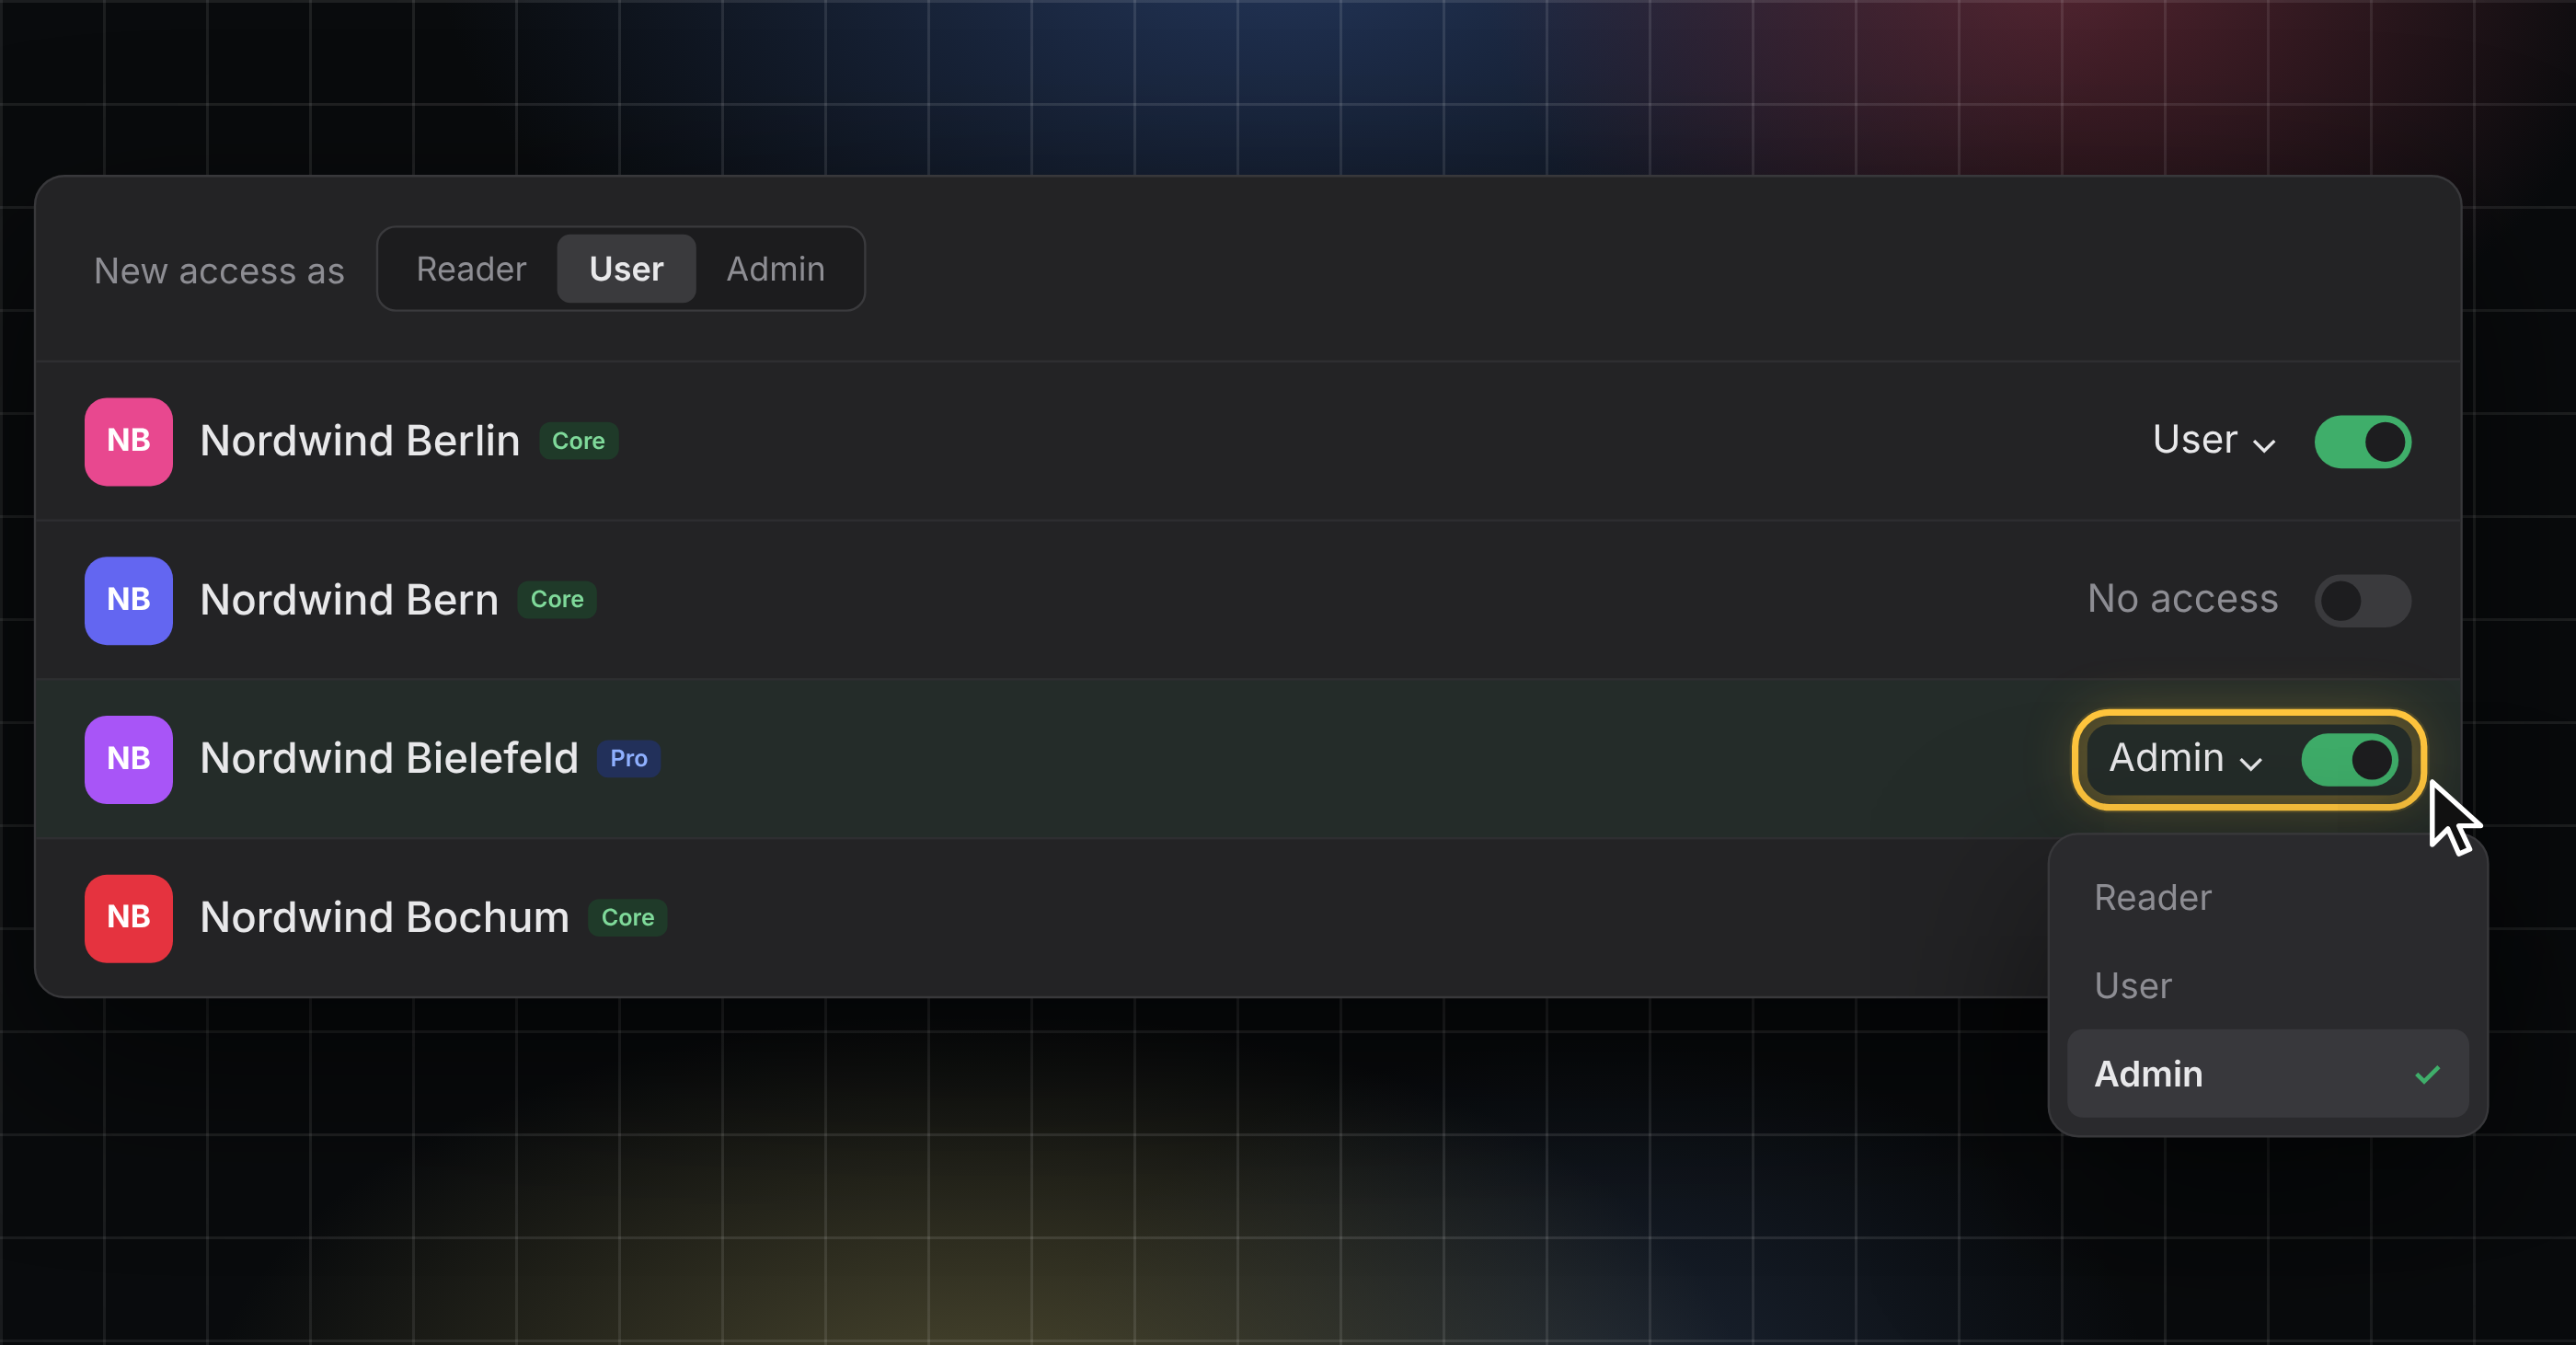
Add or remove access to spaces and change member roles
Click the count, or click the three dots menu at the end of a member's row and choose Manage space access, to open the dialog.
Switch spaces on or off with the toggle and pick a role per space: Reader, User, or Admin. Change the role later or remove access to a space in the same dialog.
Every save asks for a code from your authenticator app, so two-factor authentication must be turned on to keep your account secure.
👉 You can find this in Settings → Organization → Members. Only organization admins can change space access. Find more information here.
Stay in the Loop
We're building Indicate with you, and there's always more on the way. Take a look at our changelog anytime and join us on LinkedIn to be the first to hear what's new.
Questions, ideas, or feedback? We'd love to hear from you, so just get in touch.
The Indicate Team
Quick KPI Checks, Roles and Profile Pictures
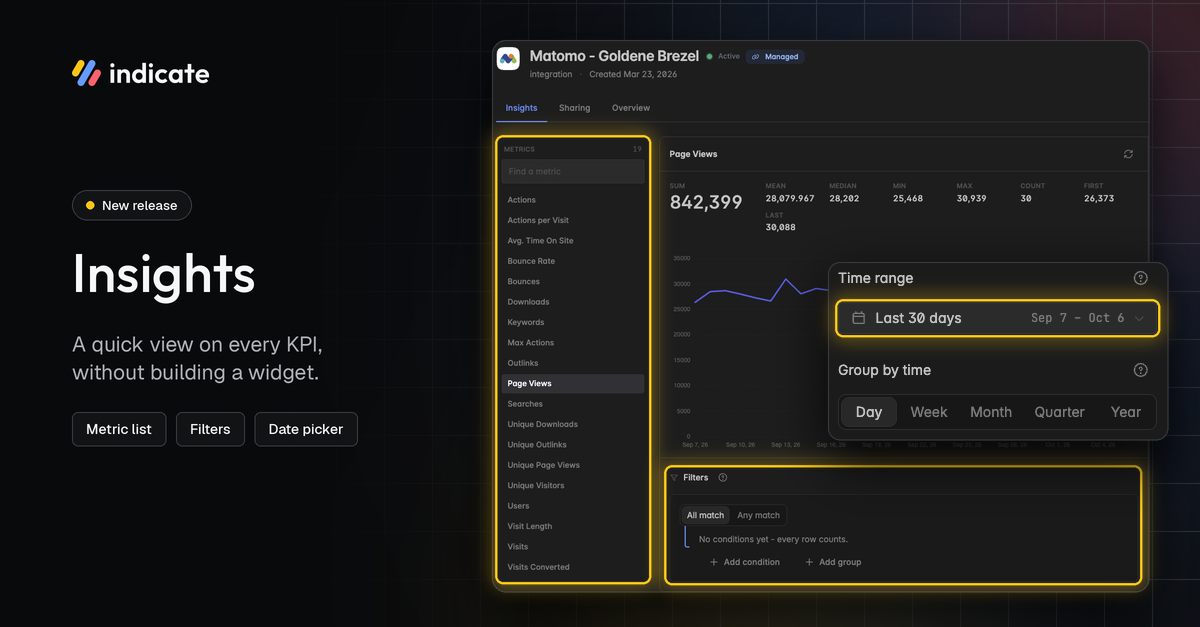
Insights: A Quick Look at Every KPI
Check what a KPI actually returns without building a dashboard or a widget. Open an insight, pick a KPI from the list and see its numbers right away. We have redesigned Insights and added new features:
Find any KPI in the metric list on the left, with a search to jump straight to it.
See the key figures at a glance: sum, mean, median, min, max, count, first and last value.
Pick a time range, either a named range like Last 30 days or a custom range of your choice, and group by day, week, month, quarter or year.
Filter the result by the insight's own dimensions, for example, one market or one channel. Combine conditions with All match or Any match.
Switch between chart and table, and between line and bars.
The view is meant as a quick check. Nothing you change here is saved. To keep a view, build a widget on a dashboard or chat with Resi.
👉 You can find this in Data Sources → Insights. Find more information here.
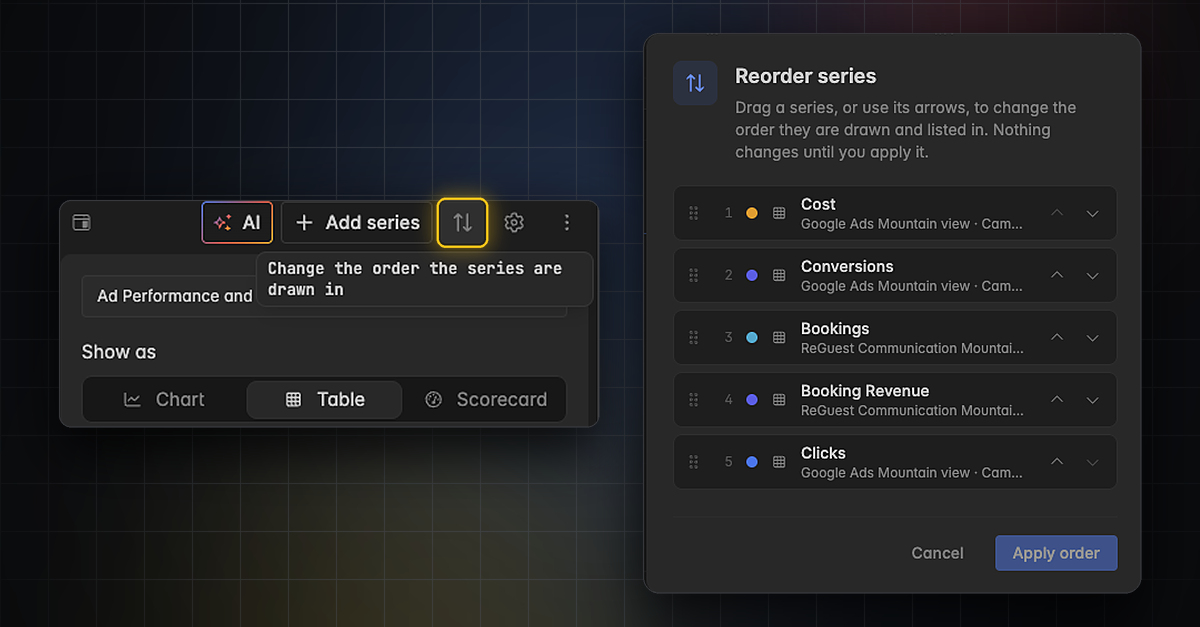
Reorder and Find Series Faster
Working with several KPIs (series) in one widget is now quicker in the widget editor.
Reorder series in a dedicated dialog. Drag a series to its new position, or move it with its arrows. Nothing changes until you click Apply order.
Jump to a new series right after you add it. The widget editor scrolls to it, so you can start editing straight away.
👉 You can find this in the widget editor. Click the arrow icon next to Add series, or open the three dots menu and choose Reorder series. Find more information here.
Roles and Permissions: See Who Can Do What
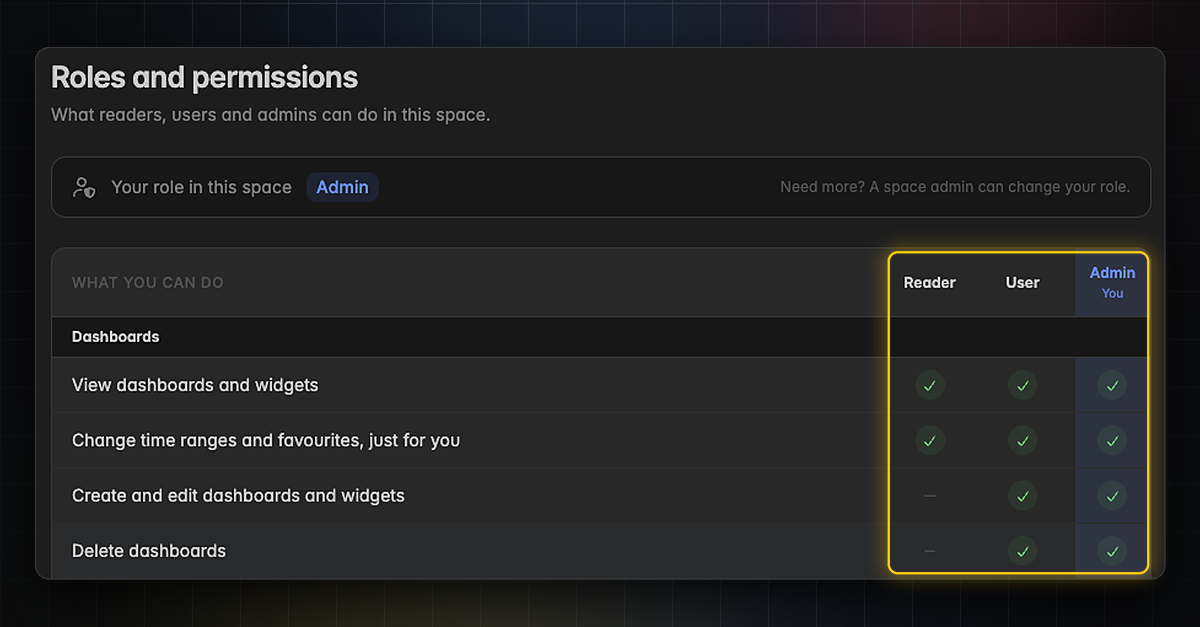
Every space has three clear roles: Reader, User and Admin. A new overview shows exactly what each role can do.
Readers view dashboards and widgets, read AI summaries and change time ranges and favorites just for themselves.
Users can also create, edit and delete dashboards and widgets, create and edit projects, use and publish dashboard templates and chat with Resi.
Admins can do everything, including managing space settings and accessing the audit log and exports.
Actions you can’t use are grayed out, with a note explaining why.
👉 You can find the overview in Settings → Space → Roles and permissions. Your own role is shown at the top. To change a role, ask a space admin. Find more information here.
Profile Pictures: Put a Face to Your Name
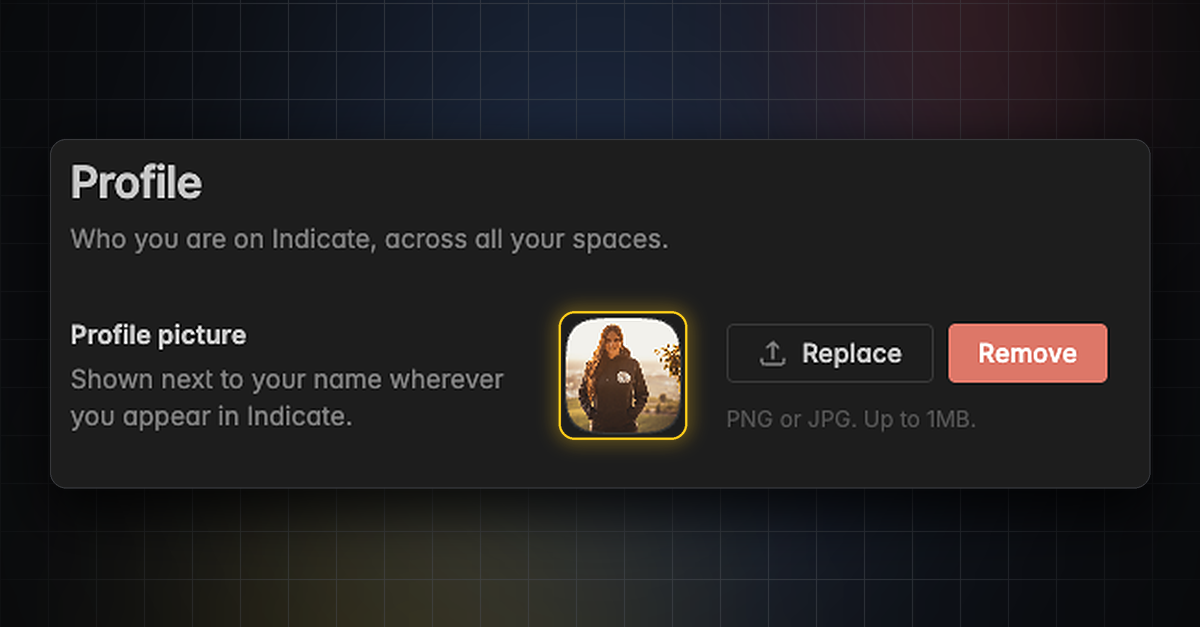
Add a profile picture to your account. It appears next to your name wherever you show up in Indicate, across all your spaces. This makes it easier to see who created a dashboard or who works on it.
Upload a PNG or JPG of up to 1 MB.
Replace or remove your picture at any time.
👉 You can find this in Settings → Account → Profile. Find more information here.
Stay in the Loop
We're building Indicate with you, and there's always more on the way. Take a look at our changelog anytime and join us on LinkedIn to be the first to hear what's new.
Questions, ideas, or feedback? We'd love to hear from you, so just get in touch.
The Indicate Team
Organizations and Brand Colors
Organizations for Multi-property: Manage All Your Spaces in One Place
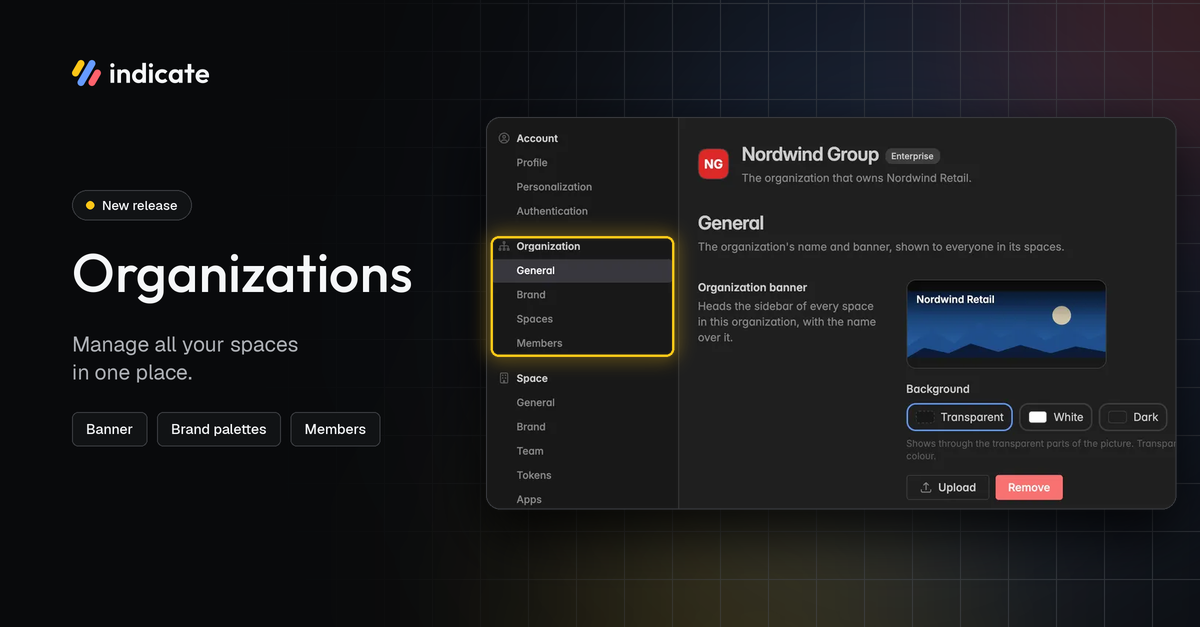
Organizations are a new level above your spaces. Hotel groups, chains, and agencies can manage all their spaces under one roof. Every space can belong to exactly one organization.
Give your organization a name and a banner that appears at the top of the sidebar in every space.
See all your organization's spaces, along with their status and plan.
Manage organization members and their roles.
Find your spaces grouped by organization in the space switcher.
👉 You can find this in Settings → Organization. Only organization members can see these settings, and only organization admins can edit them. Learn more here.
Organization membership and space access are separate. To give someone access to a space, invite them via Space Settings → Team. Learn more here.
Set Your Own Color Palettes as Brand Colors or Organization Colors
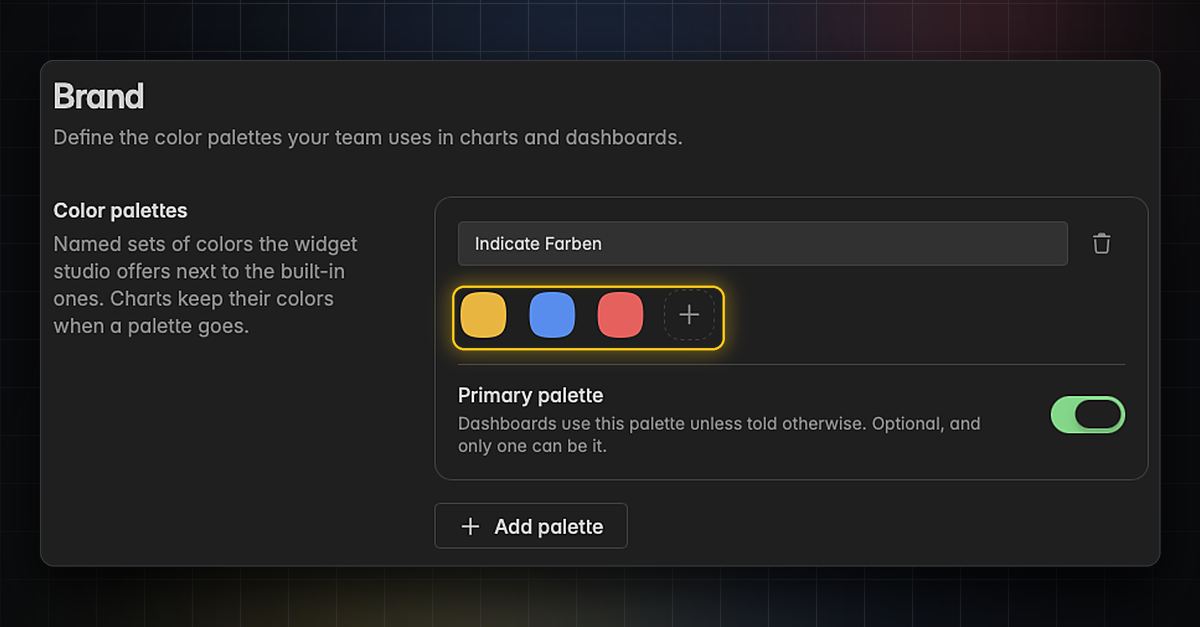
Define the color palettes your team and Resi use in charts and dashboards. Set them up for a single space, for your whole organization, or both. A hotel group can define its corporate colors once, and every property's dashboards can use them.
Create several named palettes and pick them in the widget editor next to the built-in ones.
Organization palettes appear in every space of your organization.
Set one palette as your primary palette. Dashboards and Resi then use it by default.
Delete a palette at any time. Your charts keep their colors.
👉 You can find space color palettes in Settings → Space → Brand. Find more information here.
👉 You can find organization color palettes in Settings → Organization → Brand. Learn more here.
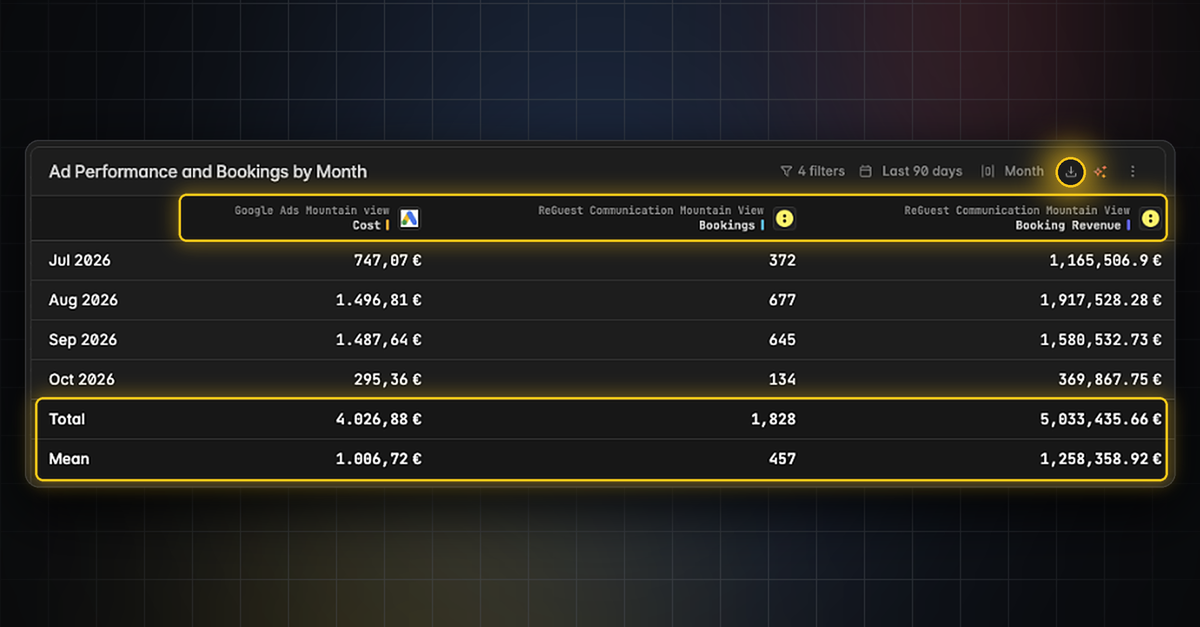
Table Widgets: Sticky Footer, Column Sources and CSV Export
Pin a table's total and mean to a sticky footer.
See the source behind every table column.
Export a table as CSV, including the comparison columns.
👉 Find out more here.
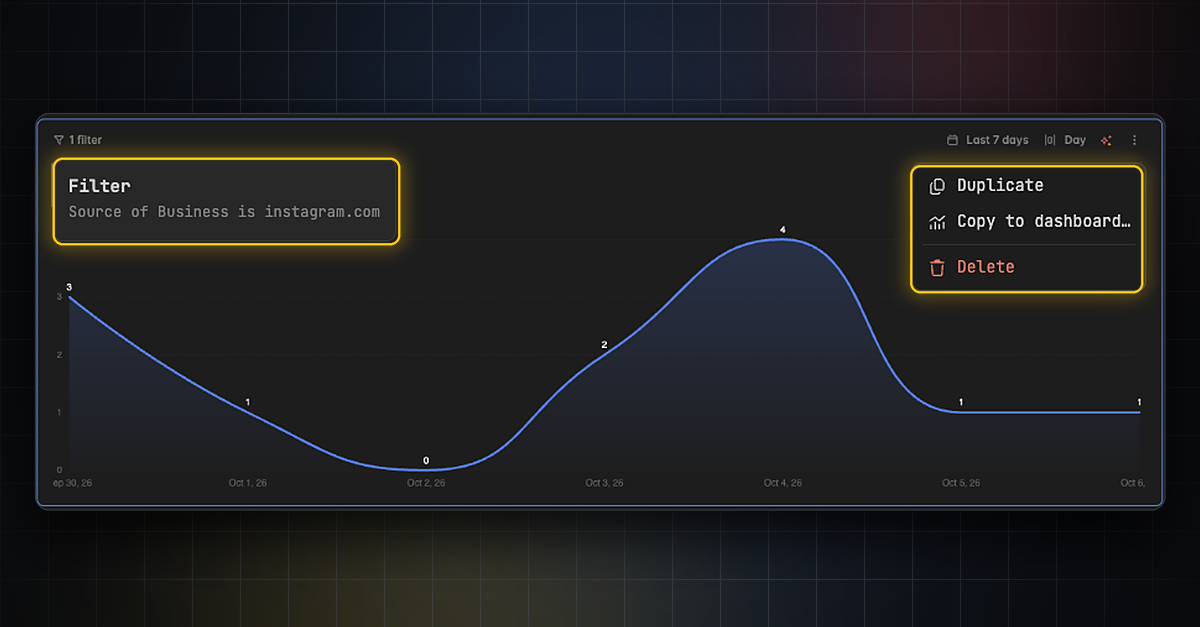
New Widget Features: Duplicate, Copy, Delete and Filter
Working with widgets is quicker, and empty widgets now explain themselves.
Duplicate a widget, copy it to another dashboard or delete it.
See what a widget is filtered to without opening the widget editor.
See which series returned no data, which sources are retired and the description of every KPI.
👉 To duplicate, copy or delete a widget, click the three dots in its top right corner. To see its filters, hover over the filter label in its top left corner. Find more information here.
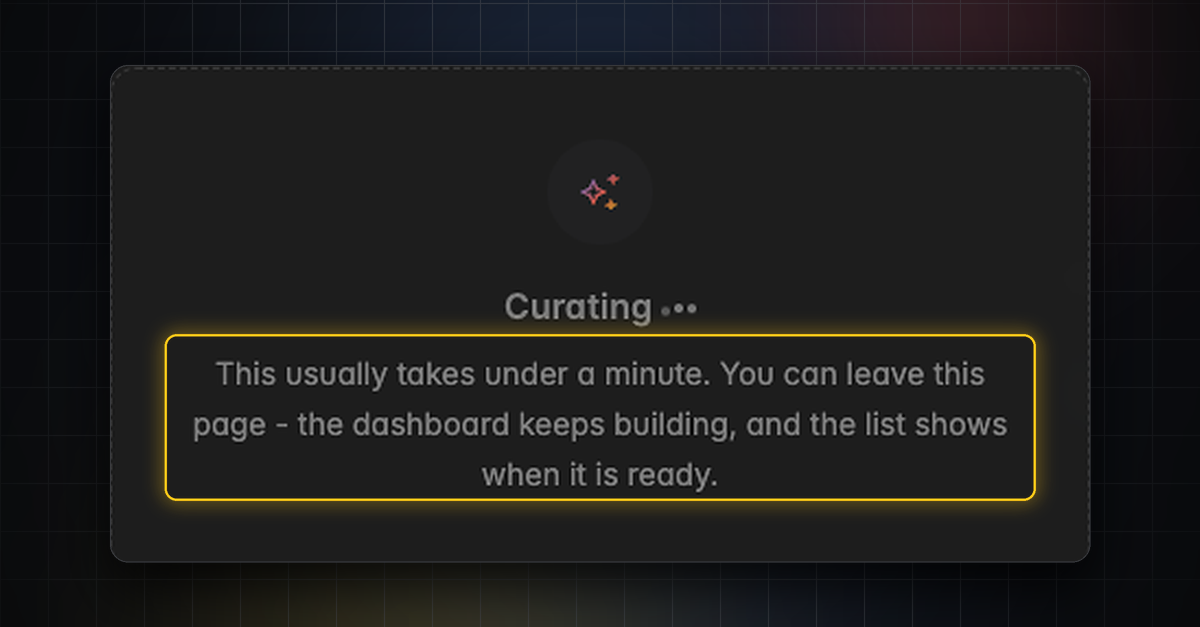
AI Background Generation: Keep Working While Dashboards Build
Dashboards and widgets generate in the background. Building a dashboard usually takes under a minute, and you can leave the page while Resi works. The board holds still while a widget is being built.
Widget Designer Redesign, New Home Screen
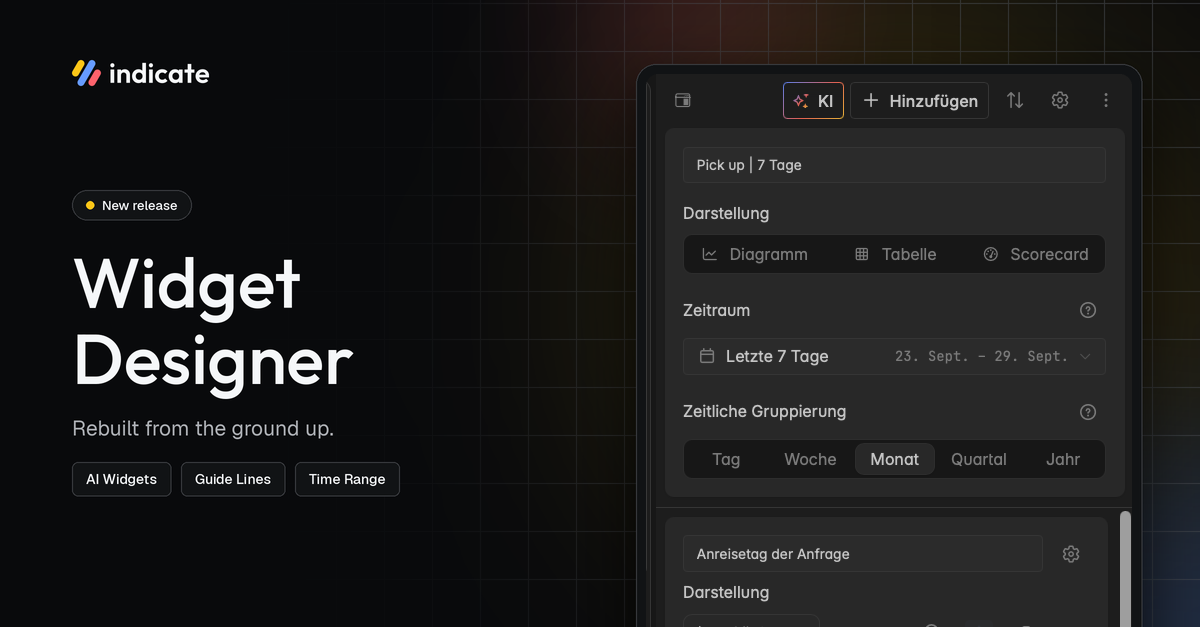
New Widget Designer
We rebuilt the entire widget designer from the ground up. You get a lot of new functionality. Building a widget feels faster and clearer from the first click.
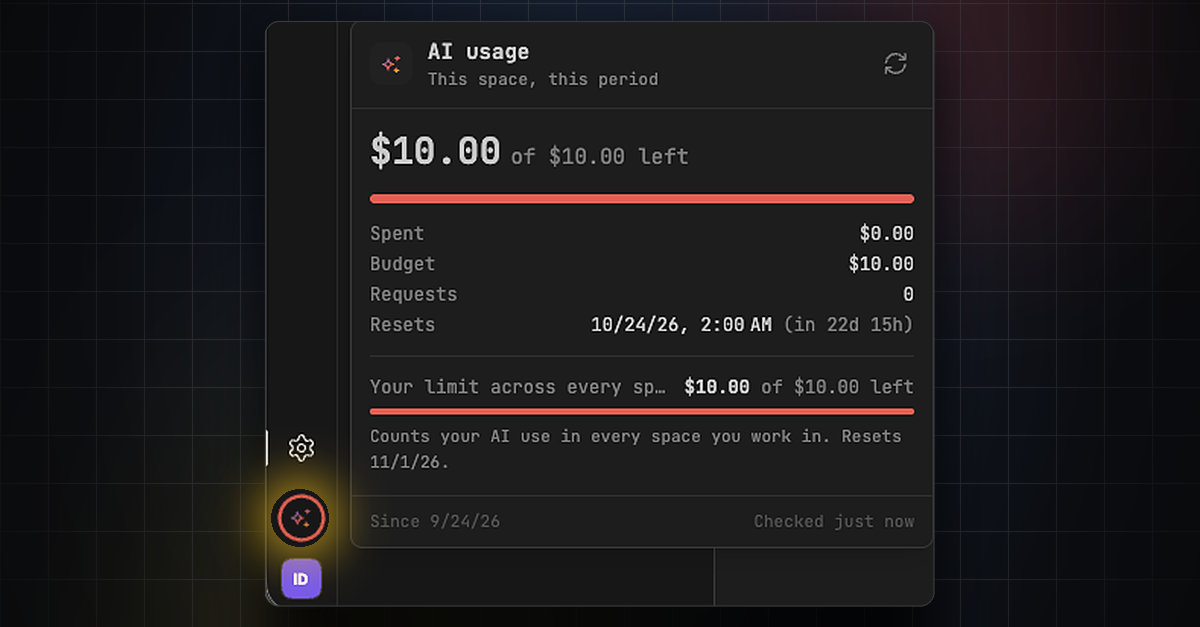
AI Usage: Higher Budget and New Models
Resi, our new AI agent, has been so well received that we are raising the included AI budget per space. Thank you for all the positive feedback! 😍
Starting today, October 1, every space on Core plans and above gets a free AI allowance of $10 per 30 days. Any single person can still use up to $10 of AI per 30 days across all their spaces (these limits are subject to change.)
You can now also choose from two new Claude AI models:
Sonnet 5.5
Opus 5.5
Review your AI usage by clicking the icon above your profile picture. You can also check your usage in Settings → Billing → AI usage.
👉 Find more information here.
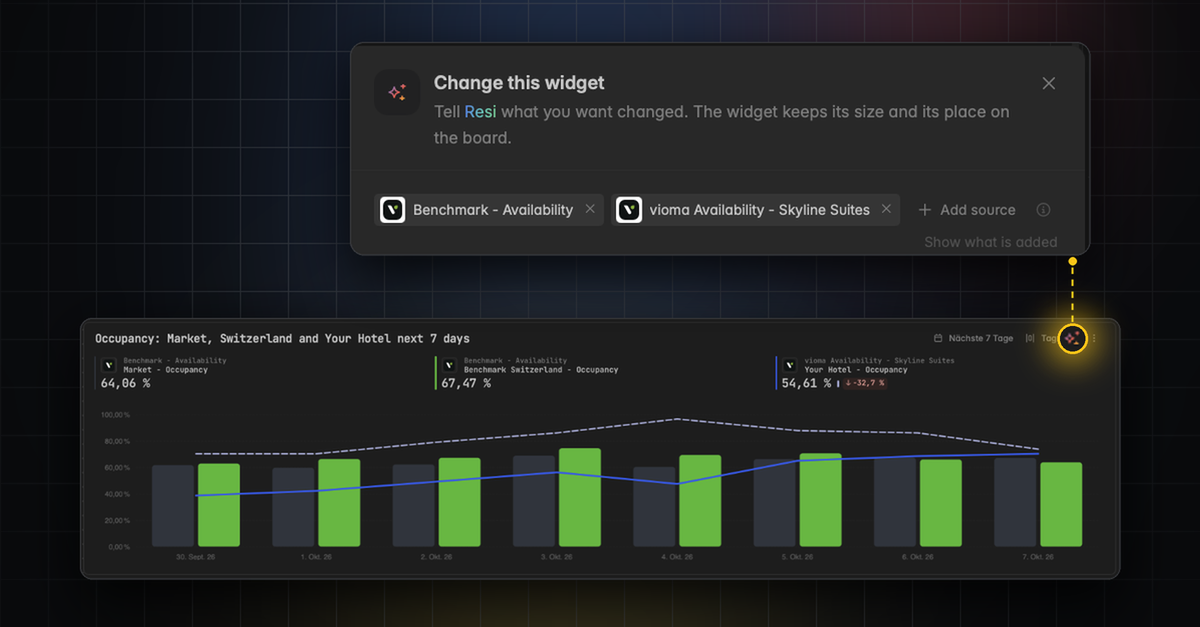
AI Widgets: Create and Edit from a Prompt
Build and change a widget by describing what you want in plain language. When you edit with AI, the prompt is prefilled with the widget's own sources, so you refine without repeating yourself. Until now, you had to rebuild the entire dashboard with AI to edit a single widget.
👉 You can find this in the widget builder and via the small colorful sparkle icon ✨ on every widget.
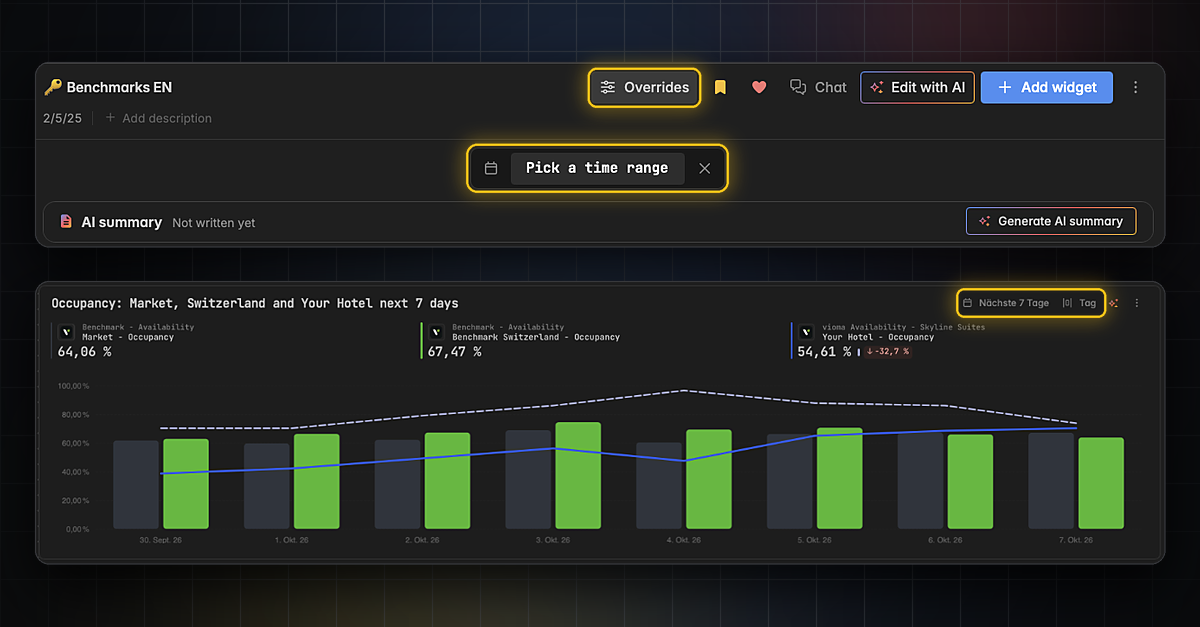
Temporarily Adjust Time Range and Granularity on Dashboards and Widgets
Quickly change the time range and time grouping (day, week, month,…) for a whole dashboard or a single widget. Your change is temporary: click the X to reset it. To change the time range permanently, use the widget designer.
👉 For a whole dashboard, click Overrides in the dashboard header and then Pick a time range. For a single widget, use the time range and grain in the top right corner of the widget.
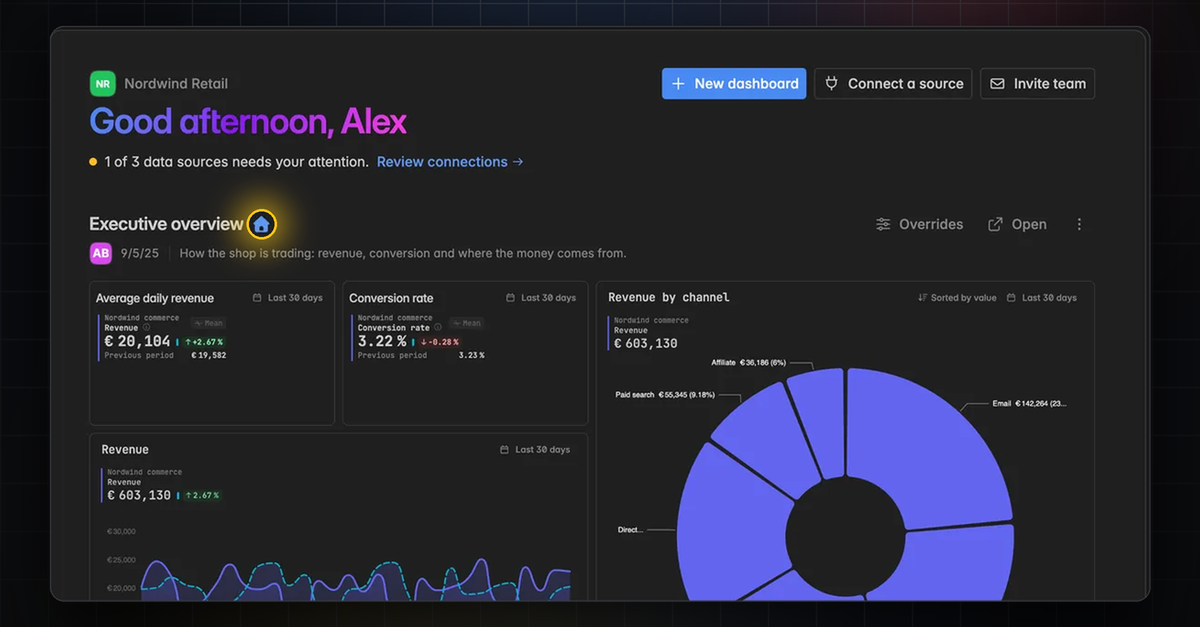
New Home Screen and more Dashboard Features
Your dashboards are now easier to share and manage.
Set any dashboard as your space's home screen.
See a dashboard's author in its header.
Edit or add a dashboard's description.
👉 You can set the home screen in Analytics → Home and learn more about dashboards here.
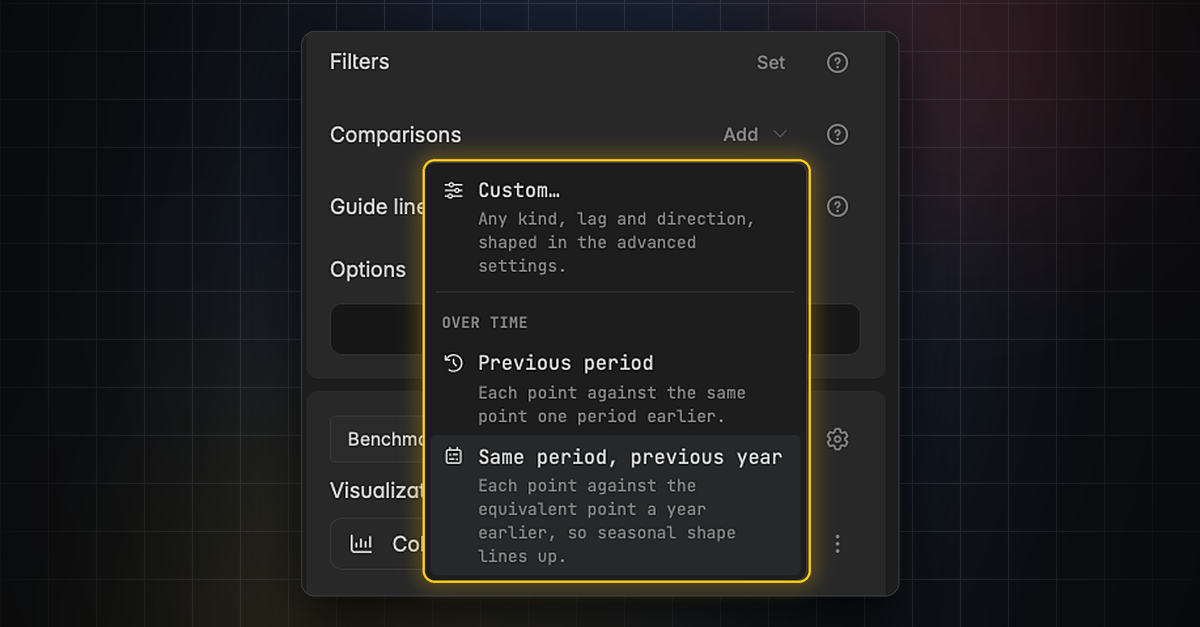
New Comparisons and Guide Lines
Reference lines are now called guide lines and are easier to set up.
Add a comparison by name, including against a guide line.
Set a comparison's polarity from the series row.
Use guide line presets, each named after the level it draws.
Want to See All Our New Features?
Here is the video from our last changelog:
👉 📹 VIDEO RELEASE UPDATE (German only)
Meet the new Indicate
100+ New Features Released
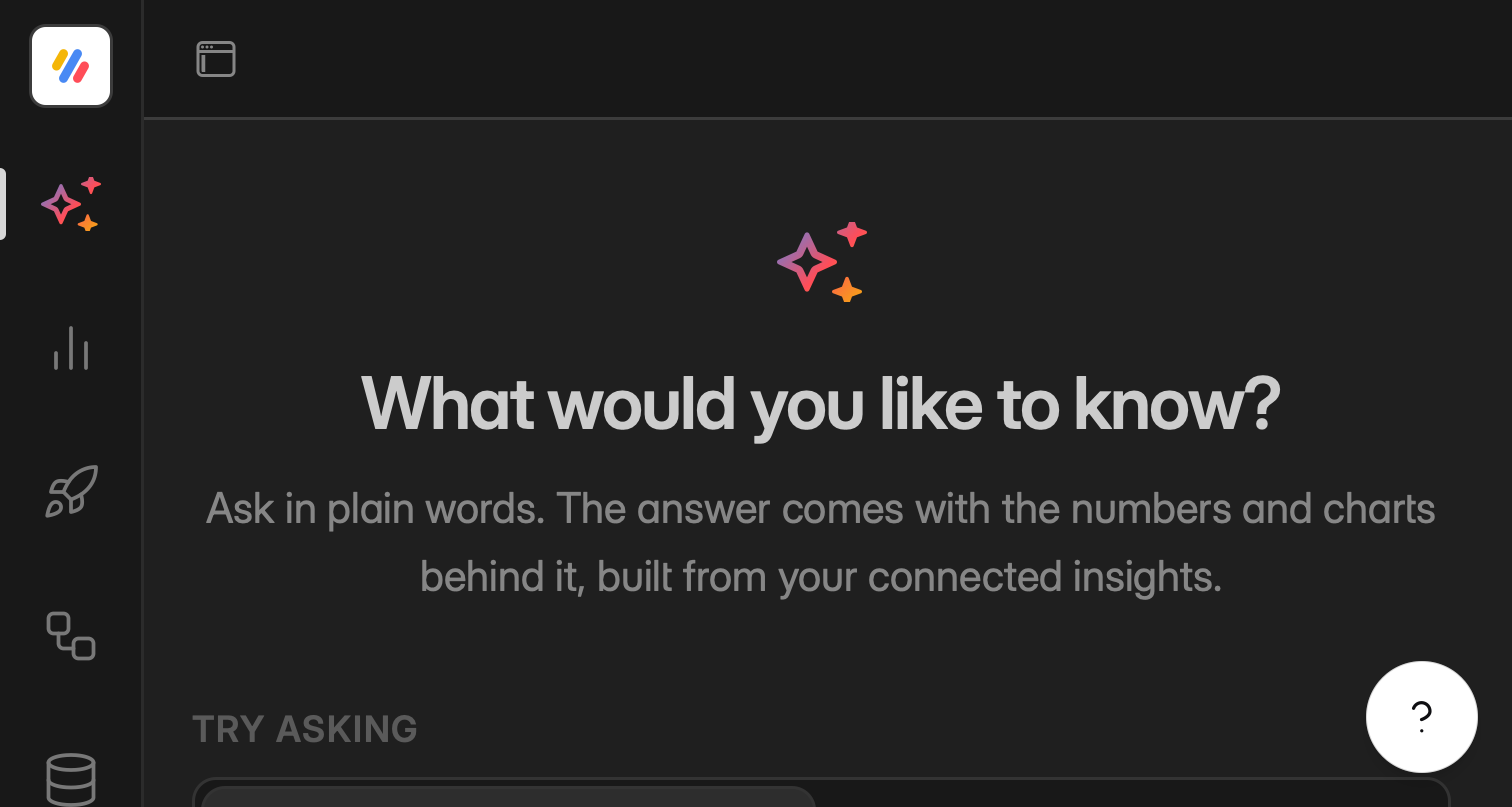
This is a big one. We rebuilt large parts of Indicate and added sooo many new features that we made a whole video to walk you through it. We are genuinely happy with how it turned out, and we cannot wait for you to try it.
There is far too much to fit into a single changelog, so we will introduce the new features one changelog at a time. We start here, with one of the features we are most excited about.
👉 Here is the video with all new functionalities 📹 VIDEO RELEASE UPDATE (German only)
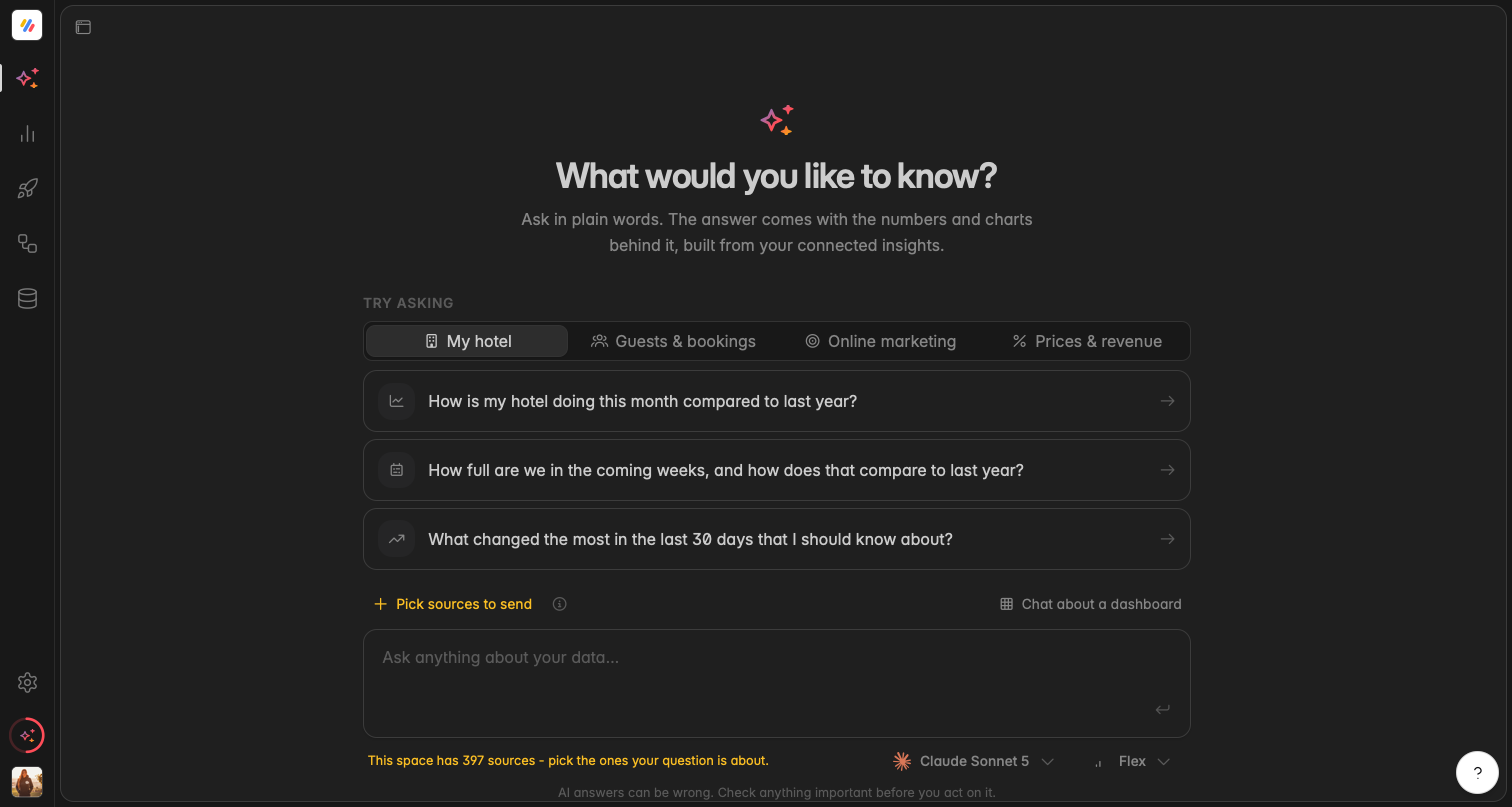
Chat with your Data: Ask Questions, Get Answers
You can now chat directly with your data in Indicate. Until now, AI helped you build dashboards and write summaries. Now you can go further and simply ask.
Type a question in plain language and get an answer straight from your own data, without building a widget or a dashboard first. It is the fastest way to check a number, explore a trend, or follow up on something you just saw.
Ask questions in everyday language.
Get answers grounded in your connected data.
Follow up in the same conversation to dig deeper.
👉 You can find the chat in the left menu right at the top.
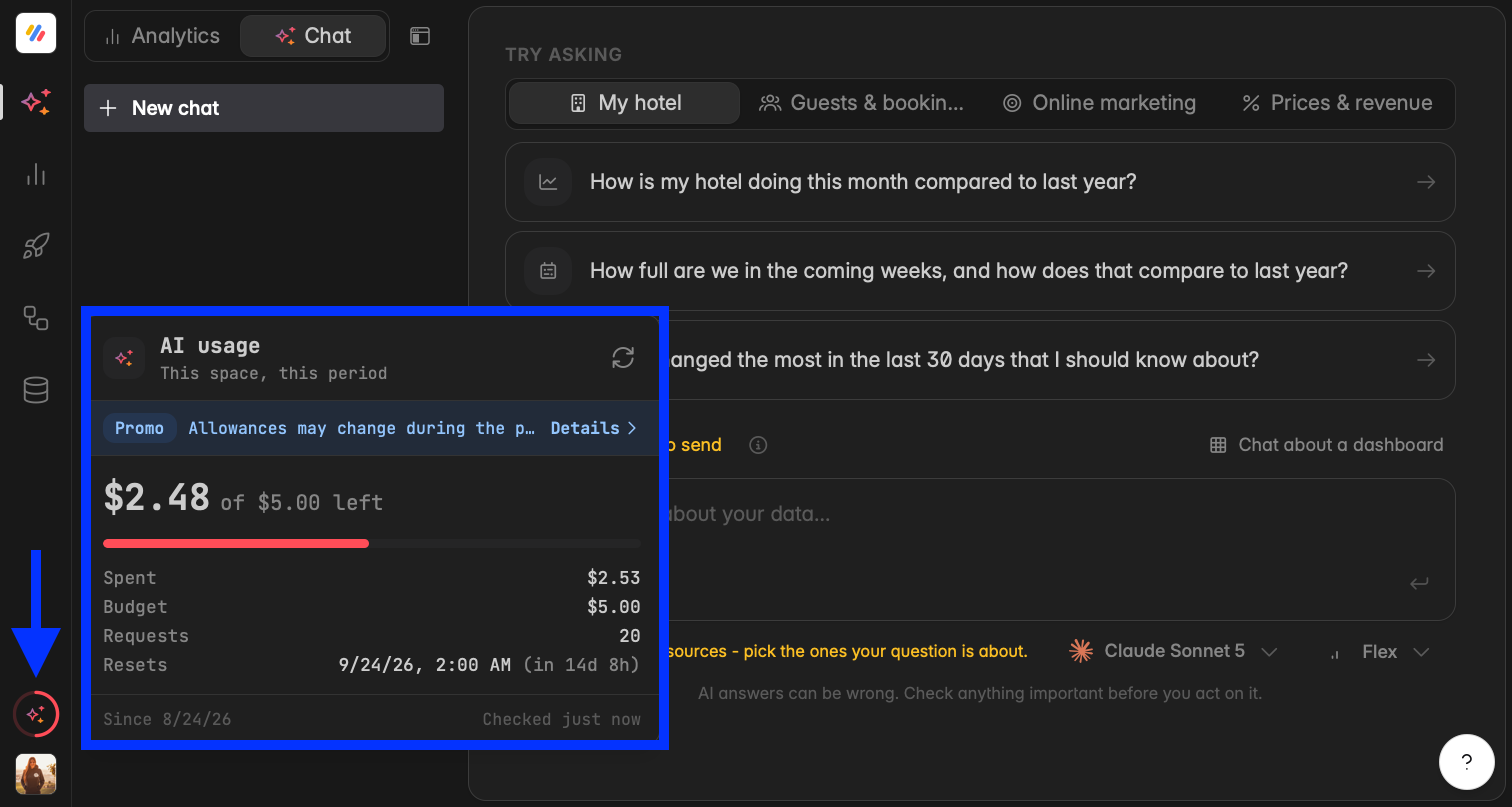
AI Usage
While the promotion runs, every space on Core plans and above gets a free AI allowance of $5 per 30 days so that you can try the new AI features. Any single person can use up to $10 of AI per 30 days across all their spaces.
Review your AI usage by clicking the icon above your profile picture. You can also check your usage in Settings → Billing → AI usage.
👉 Find more information here.
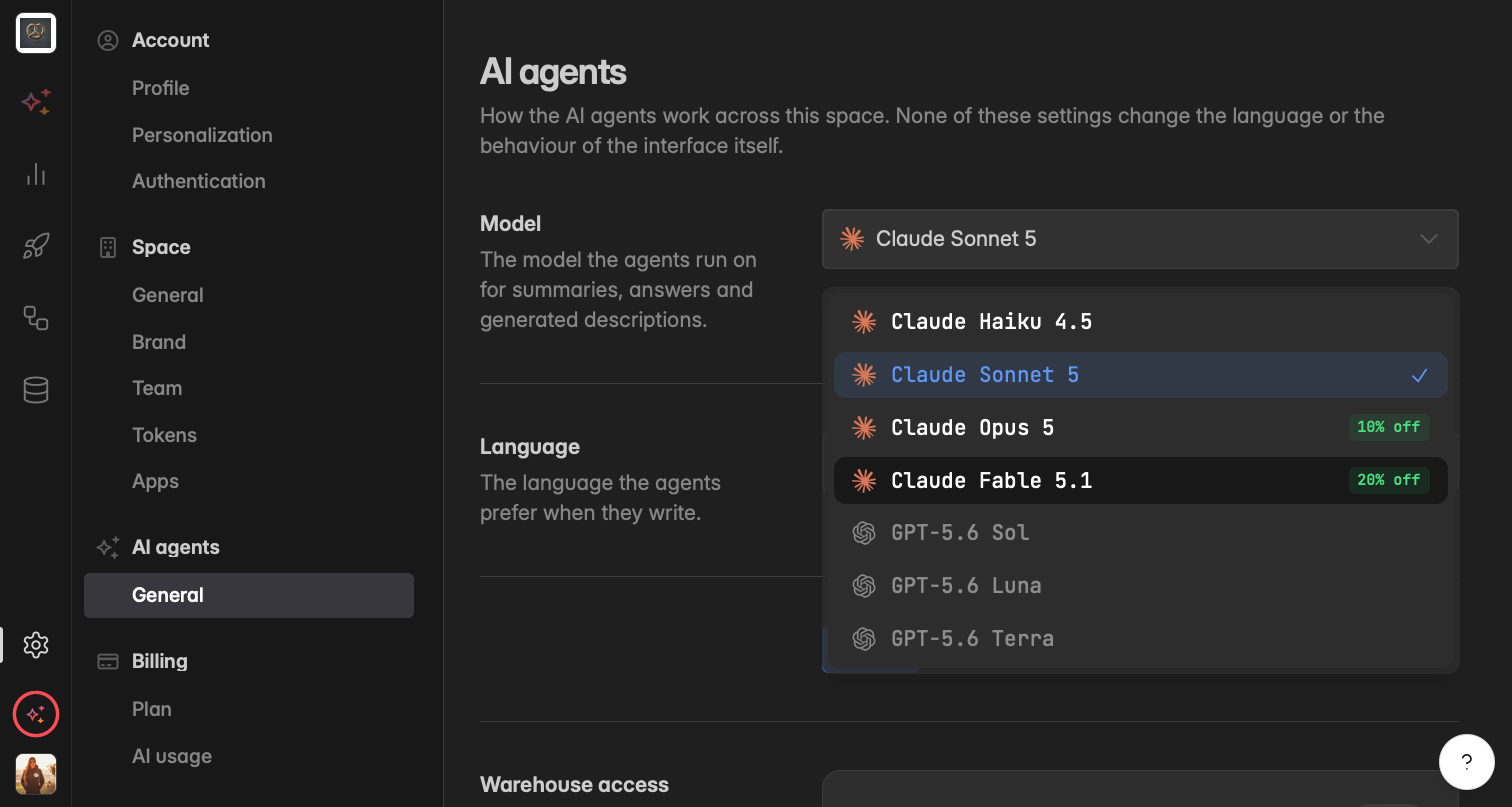
AI Models
Choose which AI model handles each prompt, and see which model produced what. You control the trade-off between speed and depth on every request, whether you are chatting with your data, generating a dashboard, changing a widget, or writing a summary.