
Build your first dashboard
Step 2 of the setup: let Resi build a dashboard from a description, install a template, or build it by hand.
What happens in this step?
You turn the Insight from step 1 into a dashboard: a page of widgets, each one a chart, table, or scorecard on one metric. Three ways to get there, from fastest to most manual: describe the dashboard to Resi, install a template, or build it by hand. This is step 2 of 4 in Start here.
You need the User role or higher. Readers see the dashboards, but cannot create them.
At least one Insight should exist in the space, see Connect your first data source. The sync does not have to be finished, widgets fill with data as it arrives.
Done when: the dashboard is in your sidebar and its widgets show numbers.
Option 1: Let Resi build it
The fastest way. You describe what you want to see, Resi picks the metrics and designs the widgets.
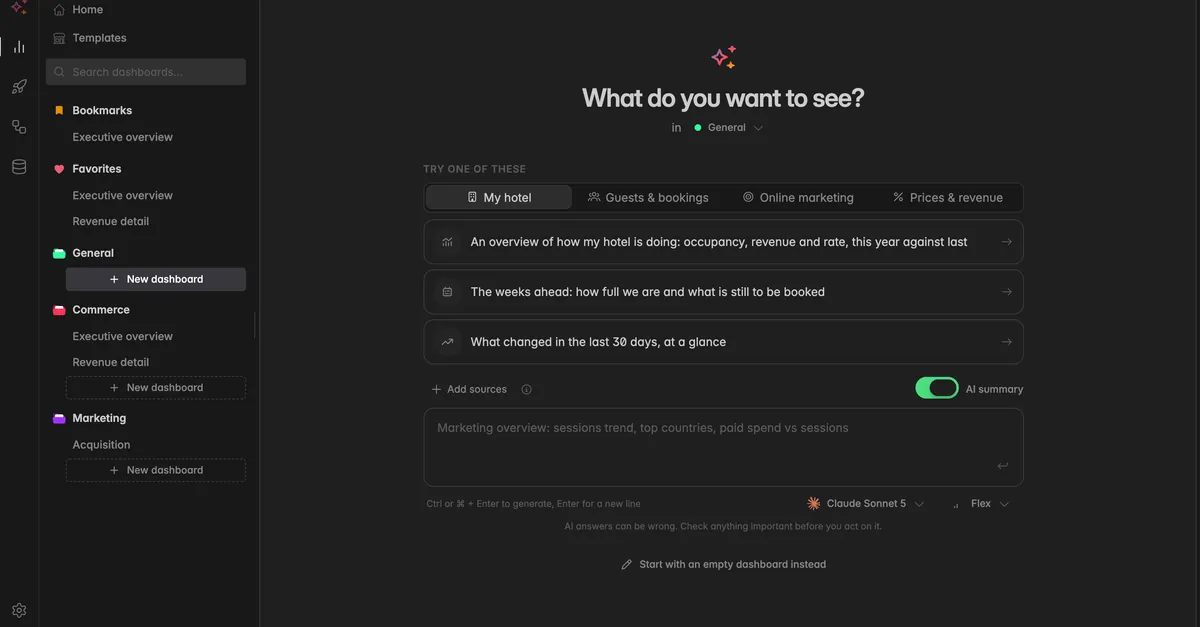
On the Home page, click New dashboard. The create page opens with the prompt Tell Resi what to show. Below the heading, in [Project] tells you which project the dashboard lands in, for example in General. Click it to pick another.
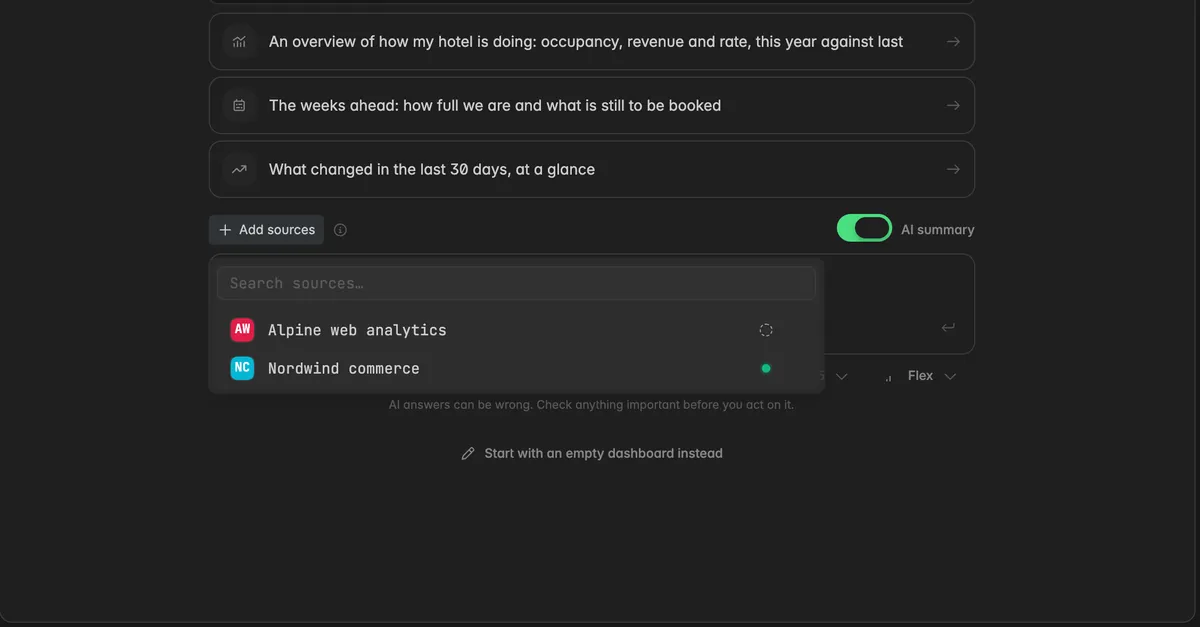
Click Add sources above the prompt and tick the Insight the dashboard is about. With the sources picked, Resi works faster and closer to what you meant.
Describe the dashboard in your own words, for example
Occupancy, ADR, and revenue for the last 90 days, by month, and the top booking channels. Under Try one of these you find example prompts by topic.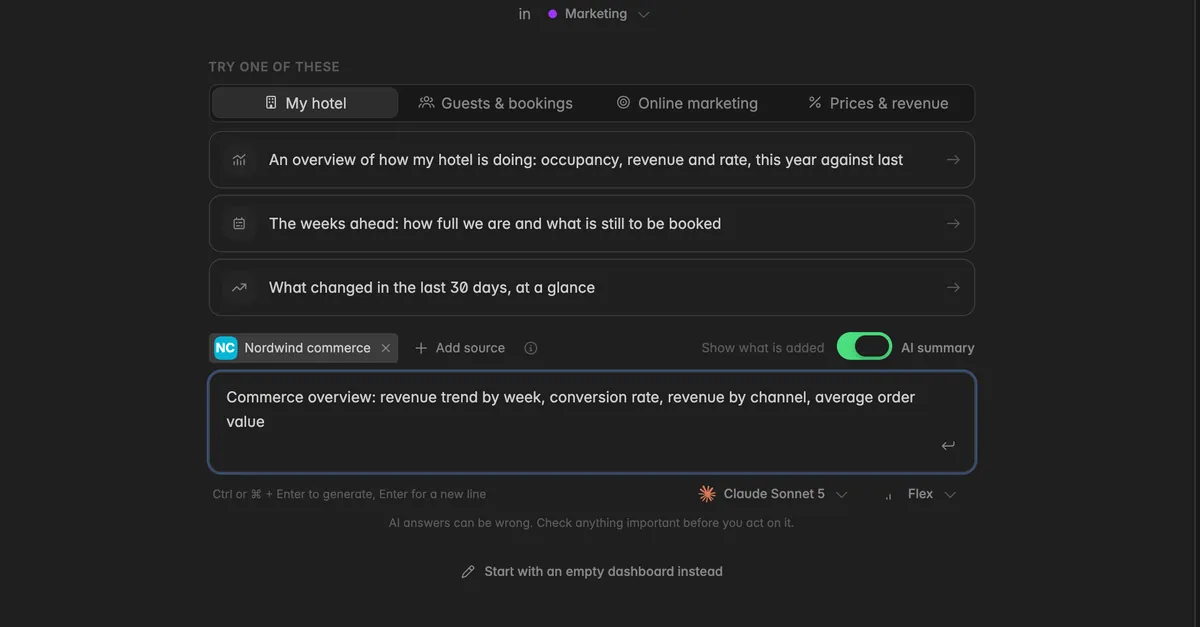
Leave AI summary on if you want a written read of the numbers above the widgets.
Click the arrow at the end of the field, or press
Ctrl+Enteror⌘+Enter.
The dashboard opens right away with a progress card while Resi works, usually under a minute. When she is done, a green banner says how many widgets she built, and the dashboard has a title and a description based on your prompt.
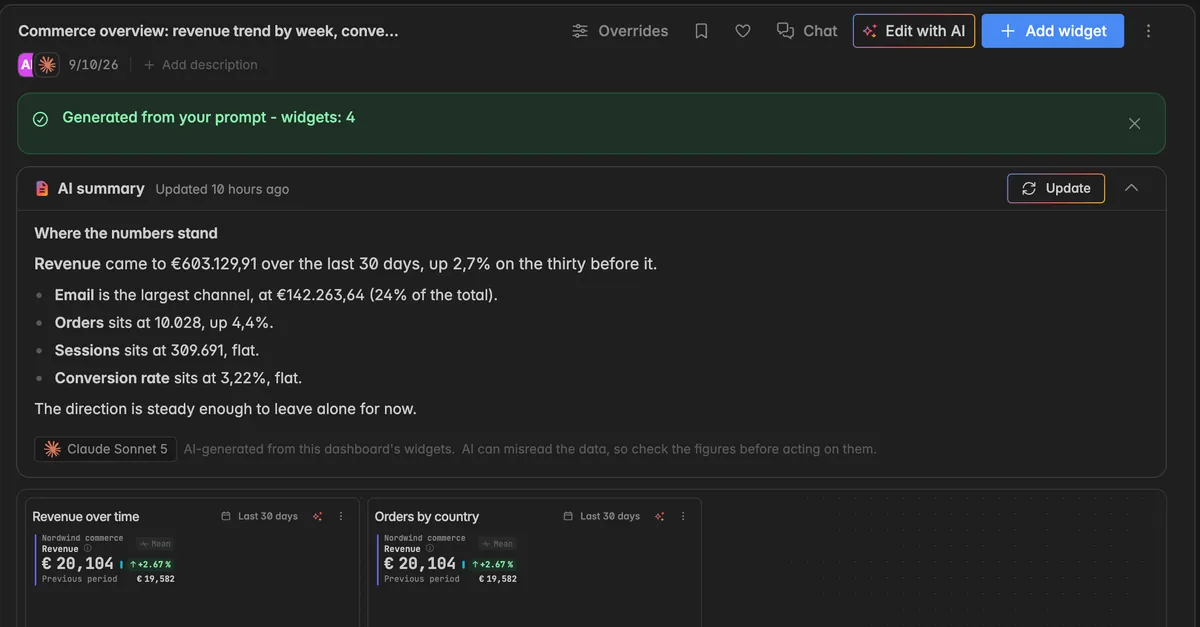
Note: Resi assembles widgets only from metrics your connected Insights deliver, she does not invent numbers. Every generated dashboard uses a share of the space's AI budget, see AI usage. Check the figures before you act on them.
Option 2: Start from a template
Templates are ready-made dashboards for hotels, built by Indicate or shared by other spaces. Installing one creates a normal dashboard in your space, filled with your own data.
In the sidebar, click Templates. The Marketplace tab lists every template you can install.
Click a template and read Included data: the KPI collections it needs. Your Insight has to be built on one of them, otherwise the widgets stay empty.
Click Use this template, enter a Dashboard name, pick the Project, and under Data map each entry to the matching Insight of your space.
Click Create dashboard.
See Templates Marketplace for updating an installed dashboard when the template changes, and for publishing your own.
Option 3: Build it by hand
On the create page, scroll down and click Start with an empty dashboard instead.
Enter a Name and click Create dashboard.
On the empty dashboard, click Add widget. Set the switch to Build it myself, pick the Data source and the Metric, and click Add widget.
Every widget starts as a line chart of the last 7 days. Click the widget name to open the editor and change the type, the time range, and everything else. See Create a widget.
Three things to do on your new dashboard
Set the time range. Click the time range on a widget card, for example Last 30 days, and pick another preset. The Overrides icon at the top right sets one range for every widget on the dashboard, only for you. See Edit widget calendar.
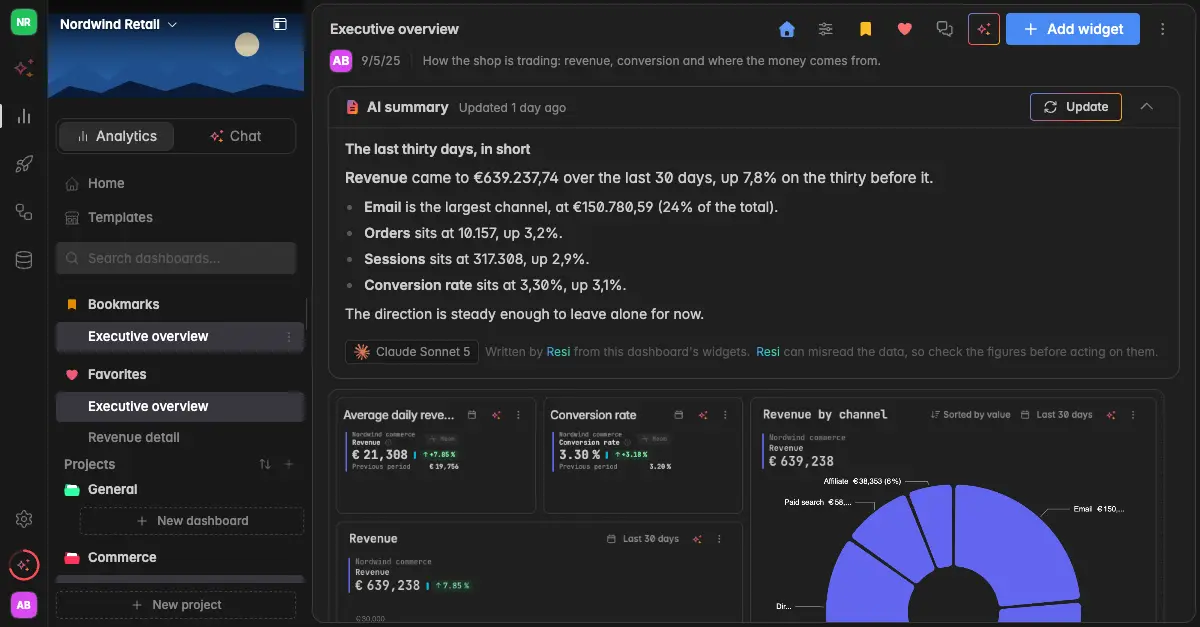
Mark it as a favourite. Click the heart at the top right. The dashboard then sits under Favorites at the top of your sidebar. See Favorite or Bookmark a dashboard.
Make it the home dashboard. Admins can show one dashboard to everyone on the Home page:
⋮→ Set as home dashboard. See Home page.
Next: Ask Resi your first question
Troubleshooting
The widgets show no data
The first sync is still running. The status line on the Home page tells you. Widgets fill as soon as data arrives.
The time range is too short for a source connected today. Click the time range on the widget and pick a wider one.
Resi built something different from what I asked
- Name the metrics and the sources in the prompt, and pick the sources with Add sources. Or open Edit with AI on the dashboard and say what should change. See Create a dashboard.
New dashboard is greyed out
- Creating dashboards needs the User role or higher. Ask a space admin. See Roles and permissions.
The template's widgets stay empty
- The template needs a KPI collection your space has no Insight for, or you chose Skip in the data mapping. See Templates Marketplace.
Was this helpful?