
Your first 10 minutes as a team member
For people invited into an existing space: accept the invitation, find your way around, read a dashboard, and know what your role allows.
Who is this for?
You were invited into a space that already exists: by your hotel, by a client, or by a colleague. The data is connected and the dashboards are built. This page shows you where everything is, what your role lets you do, and how to make the space yours, in about ten minutes. If you set up a space yourself, start with Start here instead.
Accept the invitation
Open the link in the invitation email. It is valid for 7 days.
Sign in with your Indicate account, or create one. If you already use Indicate, the new space is simply added to your account, your password and settings stay the same.
You land on the Home page of the space.
If the link has expired, ask the person who invited you to resend it. See Invite a team member.
Find your way around
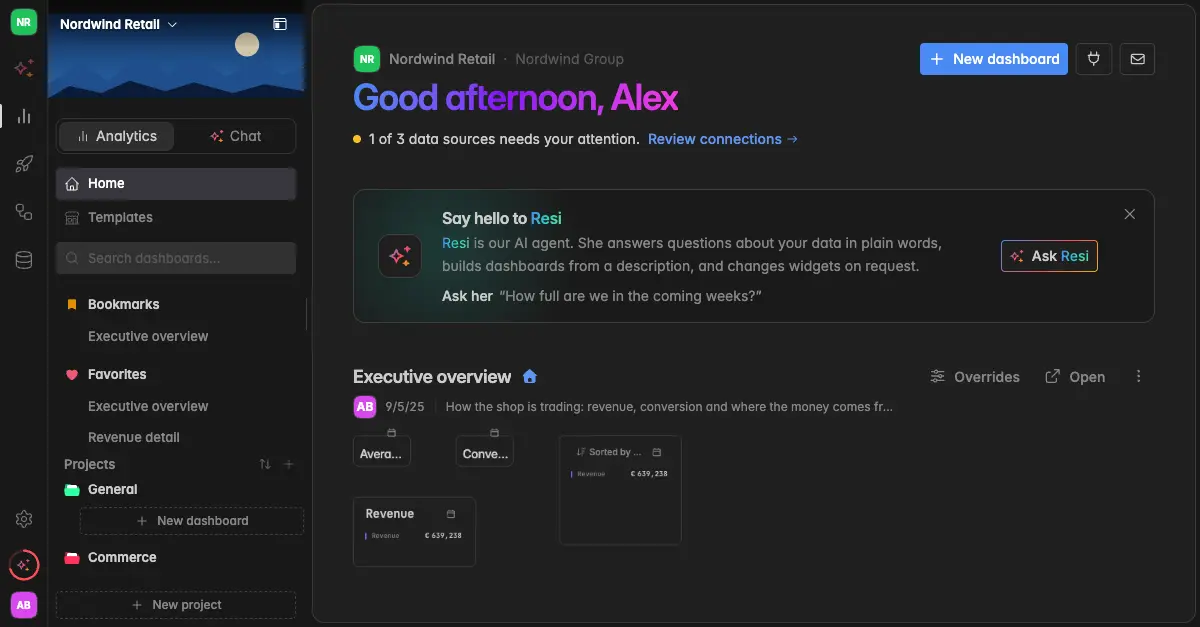
The Home page greets you with the state of the space's data sources, the home dashboard the admin picked for everyone, and under More to explore the tiles for templates, Insights, Resi, the team, and this help center. See Home page.
The sidebar lists the dashboards: Bookmarks the space pinned for everyone, Favorites you picked for yourself, and Projects, the folders the dashboards live in. Use the search box to find a dashboard by name.
The space name at the top of the sidebar switches between spaces. If you work for several hotels, each one is a space, grouped by organization.
The left rail holds the apps: Resi (sparkles), Analytics, Flying KPI, Data sources, and Settings at the bottom.
Read a dashboard
Click a dashboard in the sidebar. Every widget shows one metric for a time range.
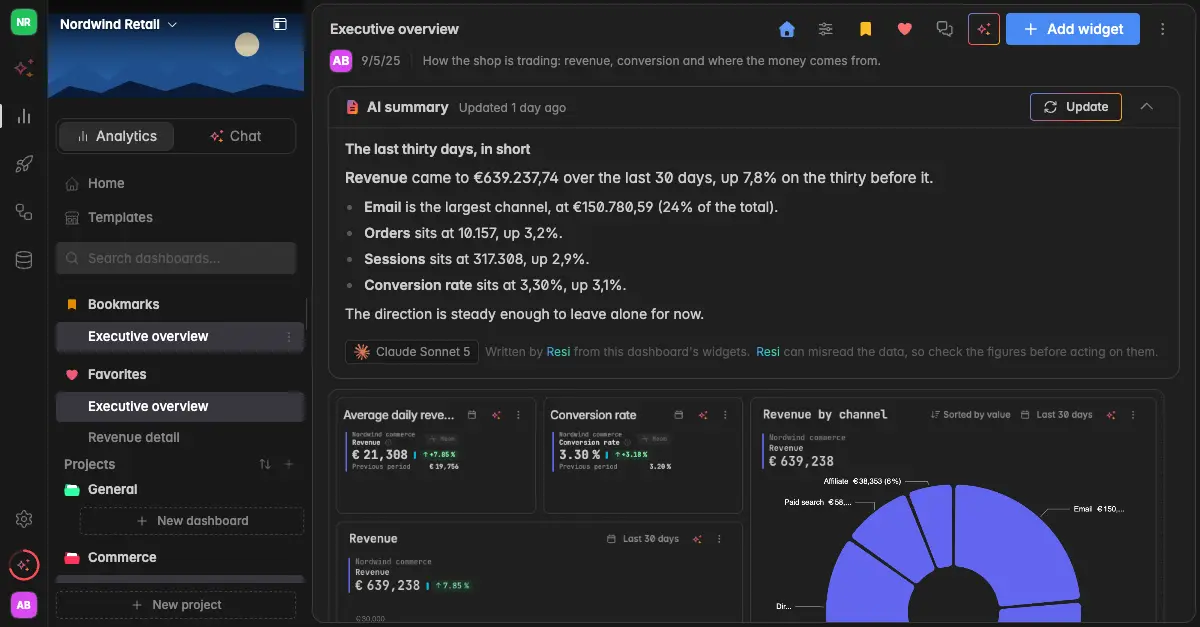
Change the time range for yourself. Click the time range on a widget card, for example Last 30 days, and pick another preset. The Overrides icon at the top right sets one range for every widget on the dashboard. Both only change your own view, the dashboard stays as it is for everyone else. See Edit widget calendar.
Read the AI summary. The card above the widgets is a written read of the numbers, written by Resi. Every role can read it.
Mark favourites. Click the heart at the top right. The dashboard then sits under Favorites at the top of your sidebar, only for you. See Favorite or Bookmark a dashboard.
Download the numbers. The
⋮menu on a widget offers Download CSV.
What your role allows
Your role is shown under Settings → Roles and permissions, with everything it allows in one table. In short:
Reader: open every dashboard, change time ranges and favourites for yourself, read AI summaries. Everything else is greyed out, with the reason on hover.
User: everything a Reader can, plus build and edit dashboards and widgets, and chat with Resi.
Admin: everything, including data sources, the team, and the settings.
If a button is greyed out and you need it, hover over it: the hint names the role it takes. A space admin can change your role. See Roles and permissions.
If you are a User: ask Resi
With the User role you can ask Resi, your AI agent, anything about the data of the space. Click the sparkles icon at the top of the left rail, pick a suggested question or type your own, and press Enter. See Ask Resi your first question.
You can also build your own dashboards: click New dashboard on the Home page and describe what you want to see. See Build your first dashboard.
Make Indicate yours
Language and theme. Under
Settings→Personalizationyou pick the interface language and Light, Dark, or System. Both are personal. See Personalization.Two-factor authentication. Under
Settings→Authenticationyou can protect your account, some spaces require it. See Authentication.Dashboards by email. Ask an admin or a User to add you as a recipient of a Flying KPI, and the dashboard arrives in your inbox on a schedule. See Flying KPI.
Troubleshooting
I see the space, but the dashboards are empty
- The space has no data source yet, or the first sync is still running. The status line on the Home page tells you. Ask the admin of the space.
I cannot edit anything
- Your role is Reader. Hover over a greyed-out button to read which role it needs, and ask a space admin if you need more. See Roles and permissions.
I am in the wrong space
- Click the space name at the top of the sidebar and pick another one. If a space is missing, nobody has invited you into it yet.
Resi does not answer me
- Resi is available from the User role up. As a Reader you see her page with the hint Resi can't talk to you - yet. Ask a space admin for the User role.
Was this helpful?